

Question: aid in making short term decisions on resource allocation or production. Two types of what-if analysis are Goal Seek and Scenarios. Pivot tables allow the
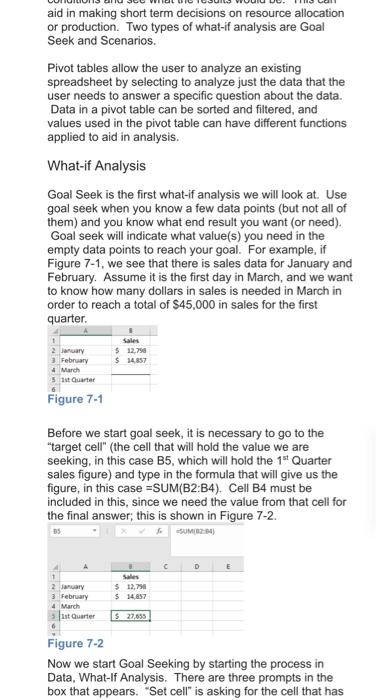
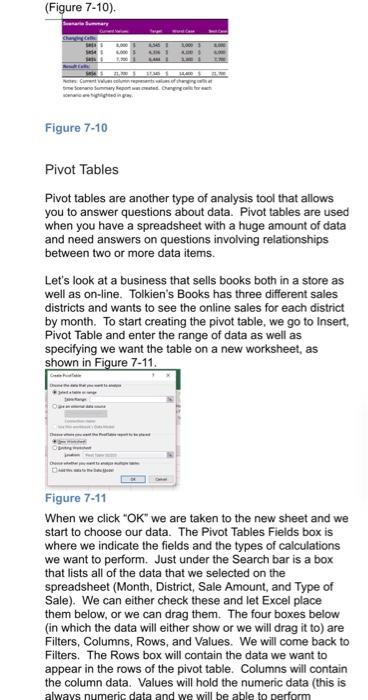
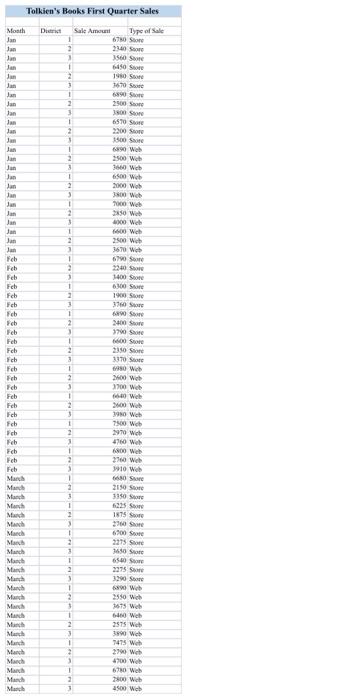
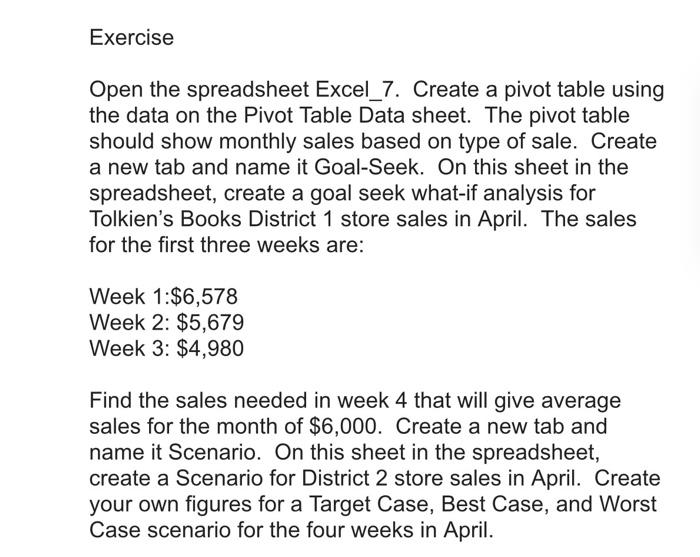
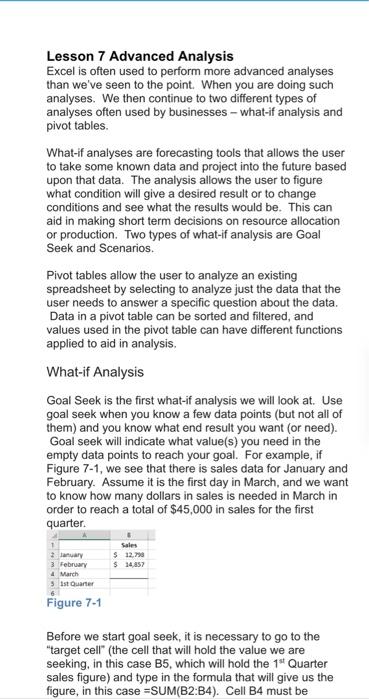
aid in making short term decisions on resource allocation or production. Two types of what-if analysis are Goal Seek and Scenarios. Pivot tables allow the user to analyze an existing spreadsheet by selecting to analyze just the data that the user needs to answer a specific question about the data. Data in a pivot table can be sorted and filtered, and values used in the pivot table can have different functions applied to aid in analysis. What-if Analysis Goal Seek is the first what-if analysis we will look at. Use goal seek when you know a few data points (but not all of them) and you know what end result you want or need). Goal seek will indicate what value(s) you need in the empty data points to reach your goal. For example, if Figure 7-1, we see that there is sales data for January and February. Assume it is the first day in March, and we want to know how many dollars in sales is needed in March in order to reach a total of $45,000 in sales for the first quarter. $12.790 $ 34,857 2 January 3 February March 5 1st Quarter 6 Figure 7-1 Before we start goal seek, it is necessary to go to the "target cell" (the cell that will hold the value we are seeking, in this case B5, which will hold the 1 Quarter sales figure) and type in the formula that will give us the figure in this case =SUM(B2:B4). Cell B4 must be included in this, since we need the value from that cell for the final answer; this is shown in Figure 7-2. c D E 1 2 January 3 February March 1st Quarter $ 12,90 $ 14,657 $ 27.655 Figure 7-2 Now we start Goal Seeking by starting the process in Data, What-If Analysis. There are three prompts in the box that appears. "Set cell" is asking for the cell that has (Figure 7-10). 11 ime Scenario Summary Rep. Cena Figure 7-10 Pivot Tables Pivot tables are another type of analysis tool that allows you to answer questions about data. Pivot tables are used when you have a spreadsheet with a huge amount of data and need answers on questions involving relationships between two or more data items. Let's look at a business that sells books both in a store as well as on-line. Tolkien's Books has three different sales districts and wants to see the online sales for each district by month. To start creating the pivot table, we go to Insert Pivot Table and enter the range of data as well as specifying we want the table on a new worksheet, as shown in Figure 7-11. Figure 7-11 When we click "OK" we are taken to the new sheet and we start to choose our data. The Pivot Tables Fields box is where we indicate the fields and the types of calculations we want to perform. Just under the Search bar is a box that lists all of the data that we selected on the spreadsheet (Month, District, Sale Amount, and Type of Sale). We can either check these and let Excel place them below, or we can drag them. The four boxes below (in which the data will either show or we will drag it to) are Filters, Columns, Rows, and Values. We will come back to Filters. The Rows box will contain the data we want to appear in the rows of the pivot table. Columns will contain the column data. Values will hold the numeric data (this is always numeric data and we will be able to perform Tolkien's Books First Quarter Sales Month Jun Jan Jan Juan Jan Jan Jan Jan Jan Jan Jan Jan Jan Jan Jan Feb Feb Fsbe Feb Feb Feb Feb ch Feb Feb Fcb Feb Feb Feb Esb Feb Feb Fch Feb ch Feb Feb Feb Feb March Man March Manh March March March Man March March March March March March MA Man Mancha March March March Mah March Manch Mac Dit Sale Amount Type of Sale 670 S 2 2340 Score 1 3500 S 1 6450 Store 2 1980 3 1670 S 1 2 2005 3 3800 Stone 1 650 S 2 2200 3 1500 1 690 Web 2 100 Wh 3 WWW 1 6500 W 2 2000 W 3 1800 W ! 700 W 2 0 W 1 300 W 1 00 W 2500 W 1 3670 W ! 670 S 2 3 1400 1 6300 S 2 1900 Store 3 3760 Sore 1 WS 2 3400 ore 3 370 S 1 Store 2 20 Store 3 3370 S 1 WOW 2400 Web 3 3700 W 1 Web 300 W 3 390 W 1 700 W 2 270 W 4700 W 1 600 W 2 2700 Web 3 1910 Web 1 0 S 2 2150 Store 3 1150 S 1 6325 2 1875 Sore 3 6700 S 3 3275 Store 1 Store 1 3275 S 3 3290 Score 1 69 Web 2 250 W $ 1675 W 1 Web 2 2575 Web 3 390 Web 1 7475 W 2 220 Wh 4700 W 1 6780 Web Wh 3 0 W Exercise Open the spreadsheet Excel_7. Create a pivot table using the data on the Pivot Table Data sheet. The pivot table should show monthly sales based on type of sale. Create a new tab and name it Goal-Seek. On this sheet in the spreadsheet, create a goal seek what-if analysis for Tolkien's Books District 1 store sales in April. The sales for the first three weeks are: Week 1:$6,578 Week 2: $5,679 Week 3: $4,980 Find the sales needed in week 4 that will give average sales for the month of $6,000. Create a new tab and name it Scenario. On this sheet in the spreadsheet, create a Scenario for District 2 store sales in April. Create your own figures for a Target Case, Best Case, and Worst Case scenario for the four weeks in April. Lesson 7 Advanced Analysis Excel is often used to perform more advanced analyses than we've seen to the point. When you are doing such analyses. We then continue to two different types of analyses often used by businesses-what-if analysis and pivot tables. What-if analyses are forecasting tools that allows the user to take some known data and project into the future based upon that data. The analysis allows the user to figure what condition will give a desired result or to change conditions and see what the results would be. This can aid in making short term decisions on resource allocation or production. Two types of what-if analysis are Goal Seek and Scenarios. Pivot tables allow the user to analyze an existing spreadsheet by selecting to analyze just the data that the user needs to answer a specific question about the data. Data in a pivot table can be sorted and filtered, and values used in the pivot table can have different functions applied to aid in analysis. What-if Analysis Goal Seek is the first what-if analysis we will look at. Use goal seek when you know a few data points (but not all of them) and you know what end result you want (or need). Goal seek will indicate what value(s) you need in the empty data points to reach your goal. For example, if Figure 7-1, we see that there is sales data for January and February. Assume it is the first day in March, and we want to know how many dollars in sales is needed in March in order to reach a total of $45,000 in sales for the first quarter $12.79 $ 14,857 February 4 March 1st Quarter Figure 7-1 Before we start goal seek, it is necessary to go to the "target cell" (the cell that will hold the value we are seeking in this case B5, which will hold the 1* Quarter sales figure) and type in the formula that will give us the figure, in this case =SUM(B2:B4). Cell B4 must be aid in making short term decisions on resource allocation or production. Two types of what-if analysis are Goal Seek and Scenarios. Pivot tables allow the user to analyze an existing spreadsheet by selecting to analyze just the data that the user needs to answer a specific question about the data. Data in a pivot table can be sorted and filtered, and values used in the pivot table can have different functions applied to aid in analysis. What-if Analysis Goal Seek is the first what-if analysis we will look at. Use goal seek when you know a few data points (but not all of them) and you know what end result you want or need). Goal seek will indicate what value(s) you need in the empty data points to reach your goal. For example, if Figure 7-1, we see that there is sales data for January and February. Assume it is the first day in March, and we want to know how many dollars in sales is needed in March in order to reach a total of $45,000 in sales for the first quarter. $12.790 $ 34,857 2 January 3 February March 5 1st Quarter 6 Figure 7-1 Before we start goal seek, it is necessary to go to the "target cell" (the cell that will hold the value we are seeking, in this case B5, which will hold the 1 Quarter sales figure) and type in the formula that will give us the figure in this case =SUM(B2:B4). Cell B4 must be included in this, since we need the value from that cell for the final answer; this is shown in Figure 7-2. c D E 1 2 January 3 February March 1st Quarter $ 12,90 $ 14,657 $ 27.655 Figure 7-2 Now we start Goal Seeking by starting the process in Data, What-If Analysis. There are three prompts in the box that appears. "Set cell" is asking for the cell that has (Figure 7-10). 11 ime Scenario Summary Rep. Cena Figure 7-10 Pivot Tables Pivot tables are another type of analysis tool that allows you to answer questions about data. Pivot tables are used when you have a spreadsheet with a huge amount of data and need answers on questions involving relationships between two or more data items. Let's look at a business that sells books both in a store as well as on-line. Tolkien's Books has three different sales districts and wants to see the online sales for each district by month. To start creating the pivot table, we go to Insert Pivot Table and enter the range of data as well as specifying we want the table on a new worksheet, as shown in Figure 7-11. Figure 7-11 When we click "OK" we are taken to the new sheet and we start to choose our data. The Pivot Tables Fields box is where we indicate the fields and the types of calculations we want to perform. Just under the Search bar is a box that lists all of the data that we selected on the spreadsheet (Month, District, Sale Amount, and Type of Sale). We can either check these and let Excel place them below, or we can drag them. The four boxes below (in which the data will either show or we will drag it to) are Filters, Columns, Rows, and Values. We will come back to Filters. The Rows box will contain the data we want to appear in the rows of the pivot table. Columns will contain the column data. Values will hold the numeric data (this is always numeric data and we will be able to perform Tolkien's Books First Quarter Sales Month Jun Jan Jan Juan Jan Jan Jan Jan Jan Jan Jan Jan Jan Jan Jan Feb Feb Fsbe Feb Feb Feb Feb ch Feb Feb Fcb Feb Feb Feb Esb Feb Feb Fch Feb ch Feb Feb Feb Feb March Man March Manh March March March Man March March March March March March MA Man Mancha March March March Mah March Manch Mac Dit Sale Amount Type of Sale 670 S 2 2340 Score 1 3500 S 1 6450 Store 2 1980 3 1670 S 1 2 2005 3 3800 Stone 1 650 S 2 2200 3 1500 1 690 Web 2 100 Wh 3 WWW 1 6500 W 2 2000 W 3 1800 W ! 700 W 2 0 W 1 300 W 1 00 W 2500 W 1 3670 W ! 670 S 2 3 1400 1 6300 S 2 1900 Store 3 3760 Sore 1 WS 2 3400 ore 3 370 S 1 Store 2 20 Store 3 3370 S 1 WOW 2400 Web 3 3700 W 1 Web 300 W 3 390 W 1 700 W 2 270 W 4700 W 1 600 W 2 2700 Web 3 1910 Web 1 0 S 2 2150 Store 3 1150 S 1 6325 2 1875 Sore 3 6700 S 3 3275 Store 1 Store 1 3275 S 3 3290 Score 1 69 Web 2 250 W $ 1675 W 1 Web 2 2575 Web 3 390 Web 1 7475 W 2 220 Wh 4700 W 1 6780 Web Wh 3 0 W Exercise Open the spreadsheet Excel_7. Create a pivot table using the data on the Pivot Table Data sheet. The pivot table should show monthly sales based on type of sale. Create a new tab and name it Goal-Seek. On this sheet in the spreadsheet, create a goal seek what-if analysis for Tolkien's Books District 1 store sales in April. The sales for the first three weeks are: Week 1:$6,578 Week 2: $5,679 Week 3: $4,980 Find the sales needed in week 4 that will give average sales for the month of $6,000. Create a new tab and name it Scenario. On this sheet in the spreadsheet, create a Scenario for District 2 store sales in April. Create your own figures for a Target Case, Best Case, and Worst Case scenario for the four weeks in April. Lesson 7 Advanced Analysis Excel is often used to perform more advanced analyses than we've seen to the point. When you are doing such analyses. We then continue to two different types of analyses often used by businesses-what-if analysis and pivot tables. What-if analyses are forecasting tools that allows the user to take some known data and project into the future based upon that data. The analysis allows the user to figure what condition will give a desired result or to change conditions and see what the results would be. This can aid in making short term decisions on resource allocation or production. Two types of what-if analysis are Goal Seek and Scenarios. Pivot tables allow the user to analyze an existing spreadsheet by selecting to analyze just the data that the user needs to answer a specific question about the data. Data in a pivot table can be sorted and filtered, and values used in the pivot table can have different functions applied to aid in analysis. What-if Analysis Goal Seek is the first what-if analysis we will look at. Use goal seek when you know a few data points (but not all of them) and you know what end result you want (or need). Goal seek will indicate what value(s) you need in the empty data points to reach your goal. For example, if Figure 7-1, we see that there is sales data for January and February. Assume it is the first day in March, and we want to know how many dollars in sales is needed in March in order to reach a total of $45,000 in sales for the first quarter $12.79 $ 14,857 February 4 March 1st Quarter Figure 7-1 Before we start goal seek, it is necessary to go to the "target cell" (the cell that will hold the value we are seeking in this case B5, which will hold the 1* Quarter sales figure) and type in the formula that will give us the figure, in this case =SUM(B2:B4). Cell B4 must be
Step by Step Solution
There are 3 Steps involved in it

Get step-by-step solutions from verified subject matter experts