

Question: al Exam e T L L This test: 150 point(s) possible This question: 8 point(s) possible & EIL LR According to a certain government agency
![the sample [ & V] the requirements for testing the hypothesis satisfied.](https://dsd5zvtm8ll6.cloudfront.net/si.experts.images/questions/2024/10/670879a0c1156_672670879a08620a.jpg)
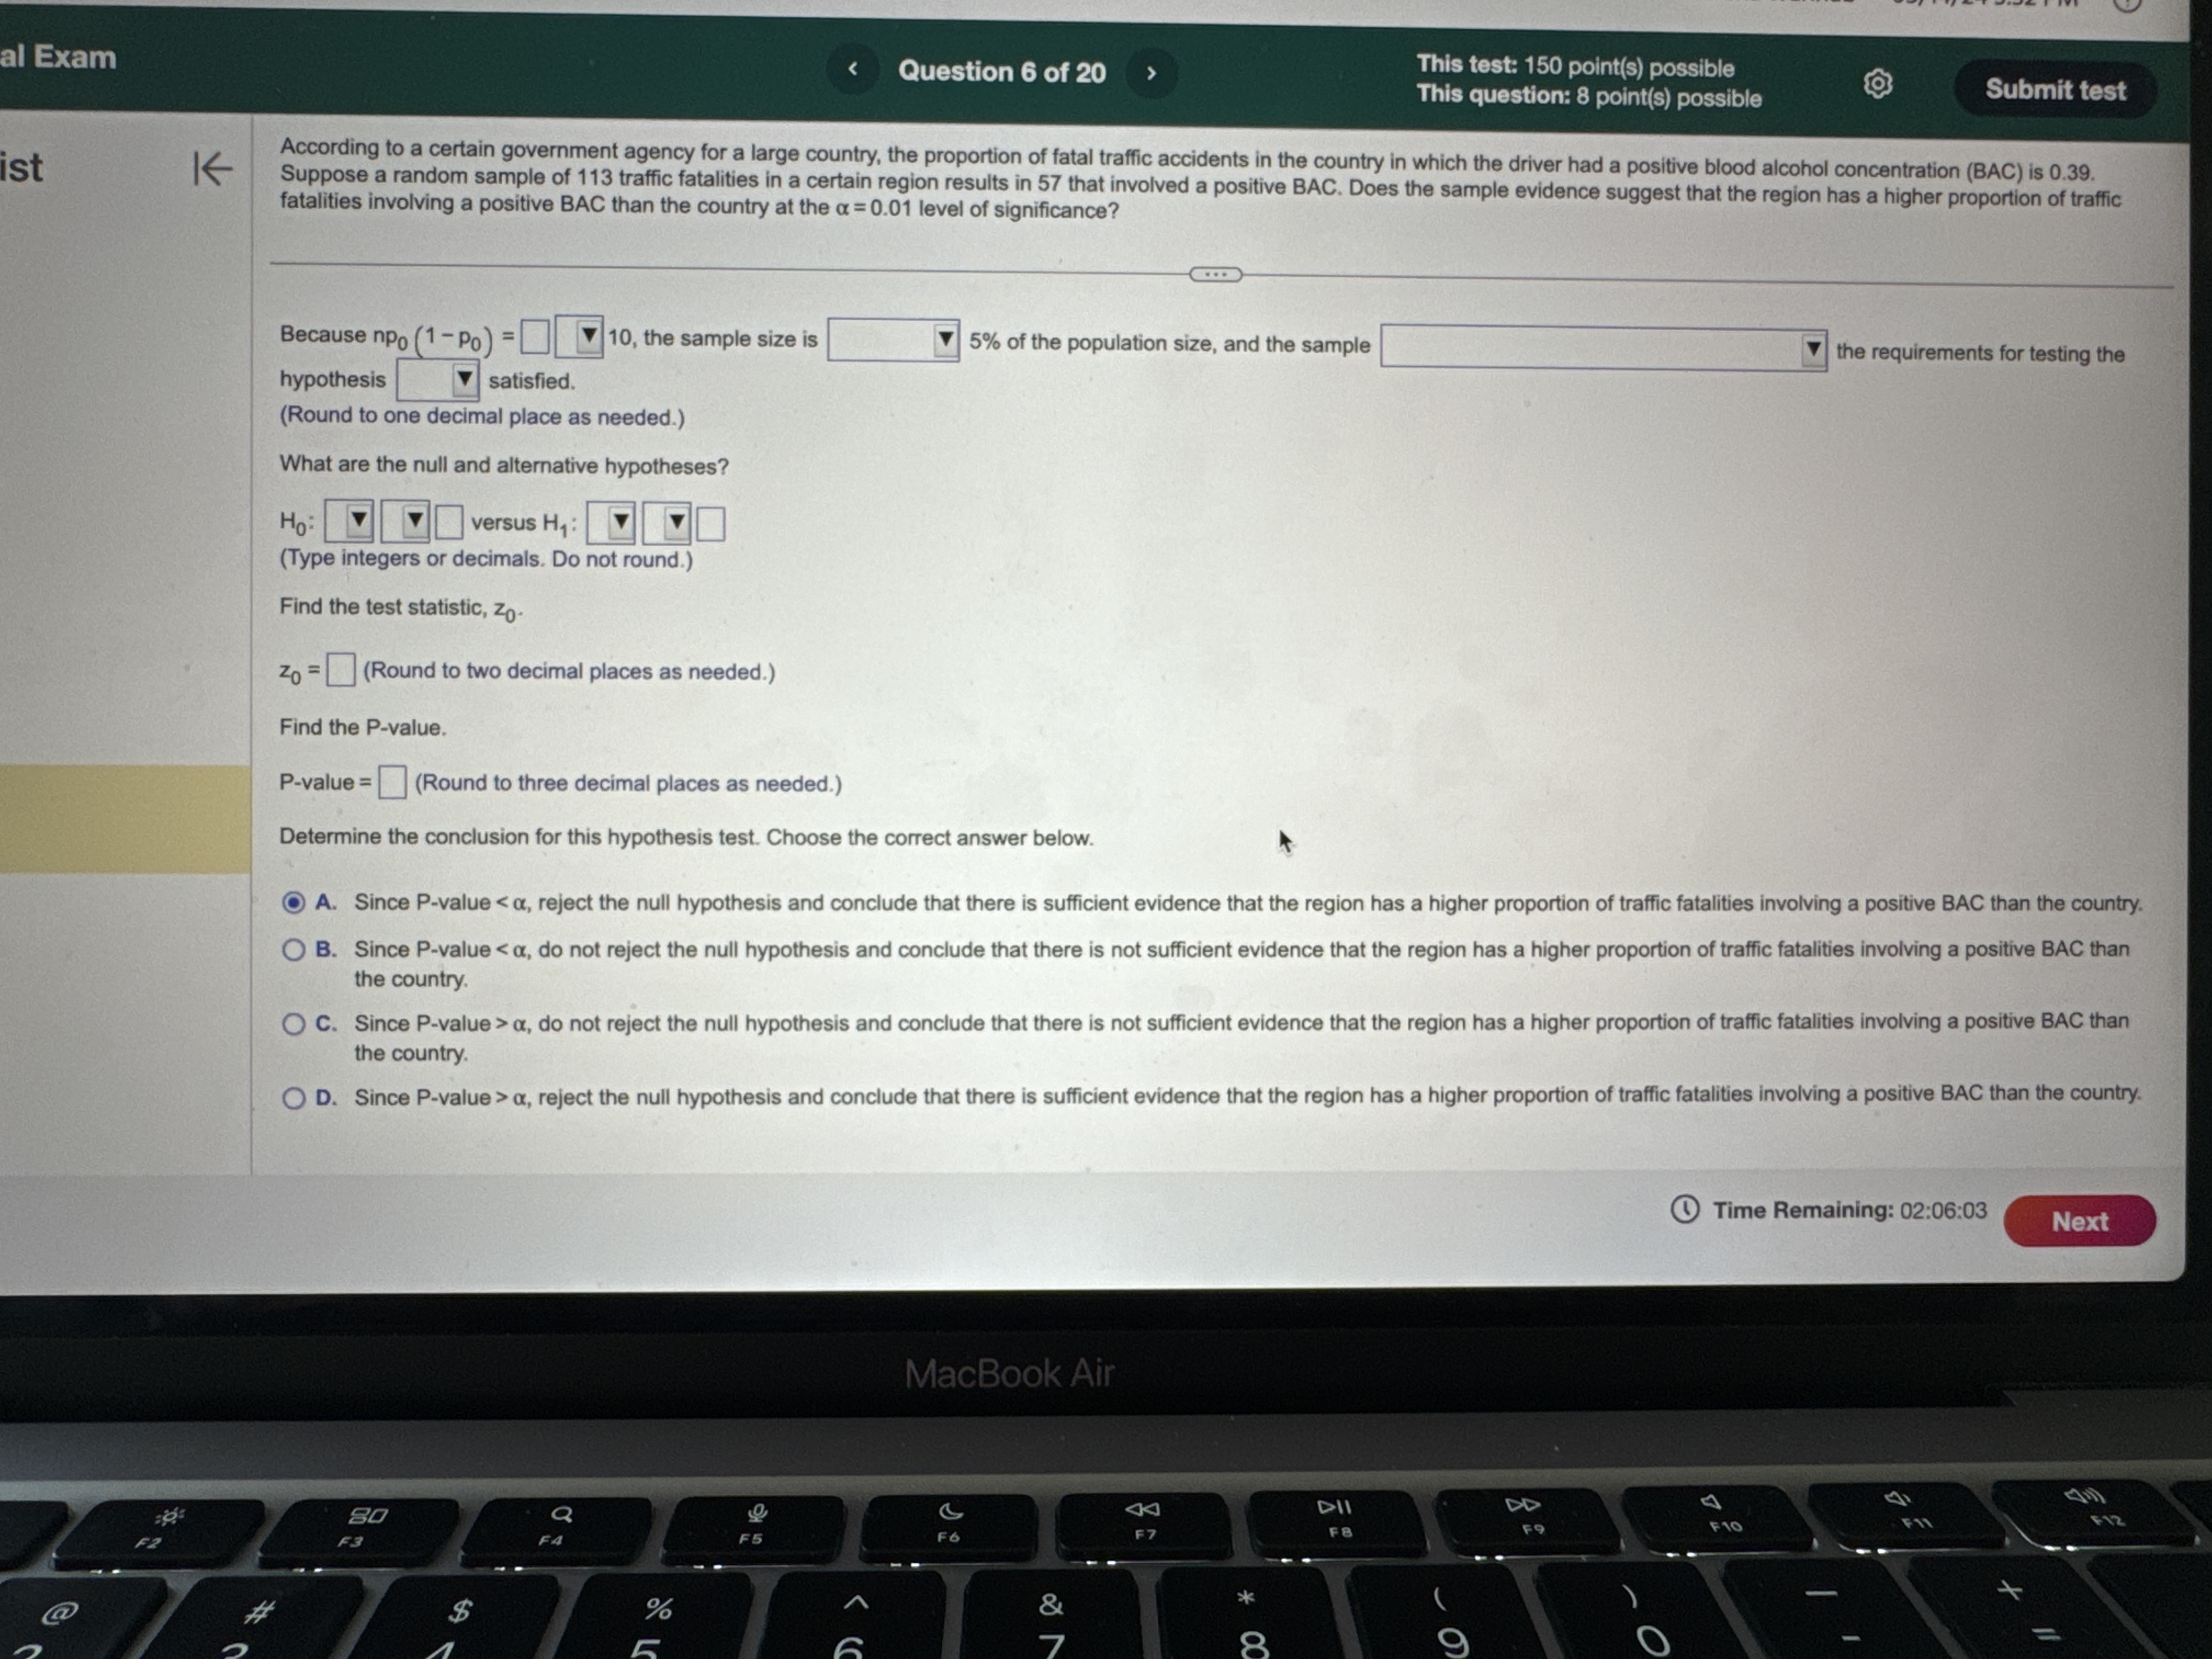
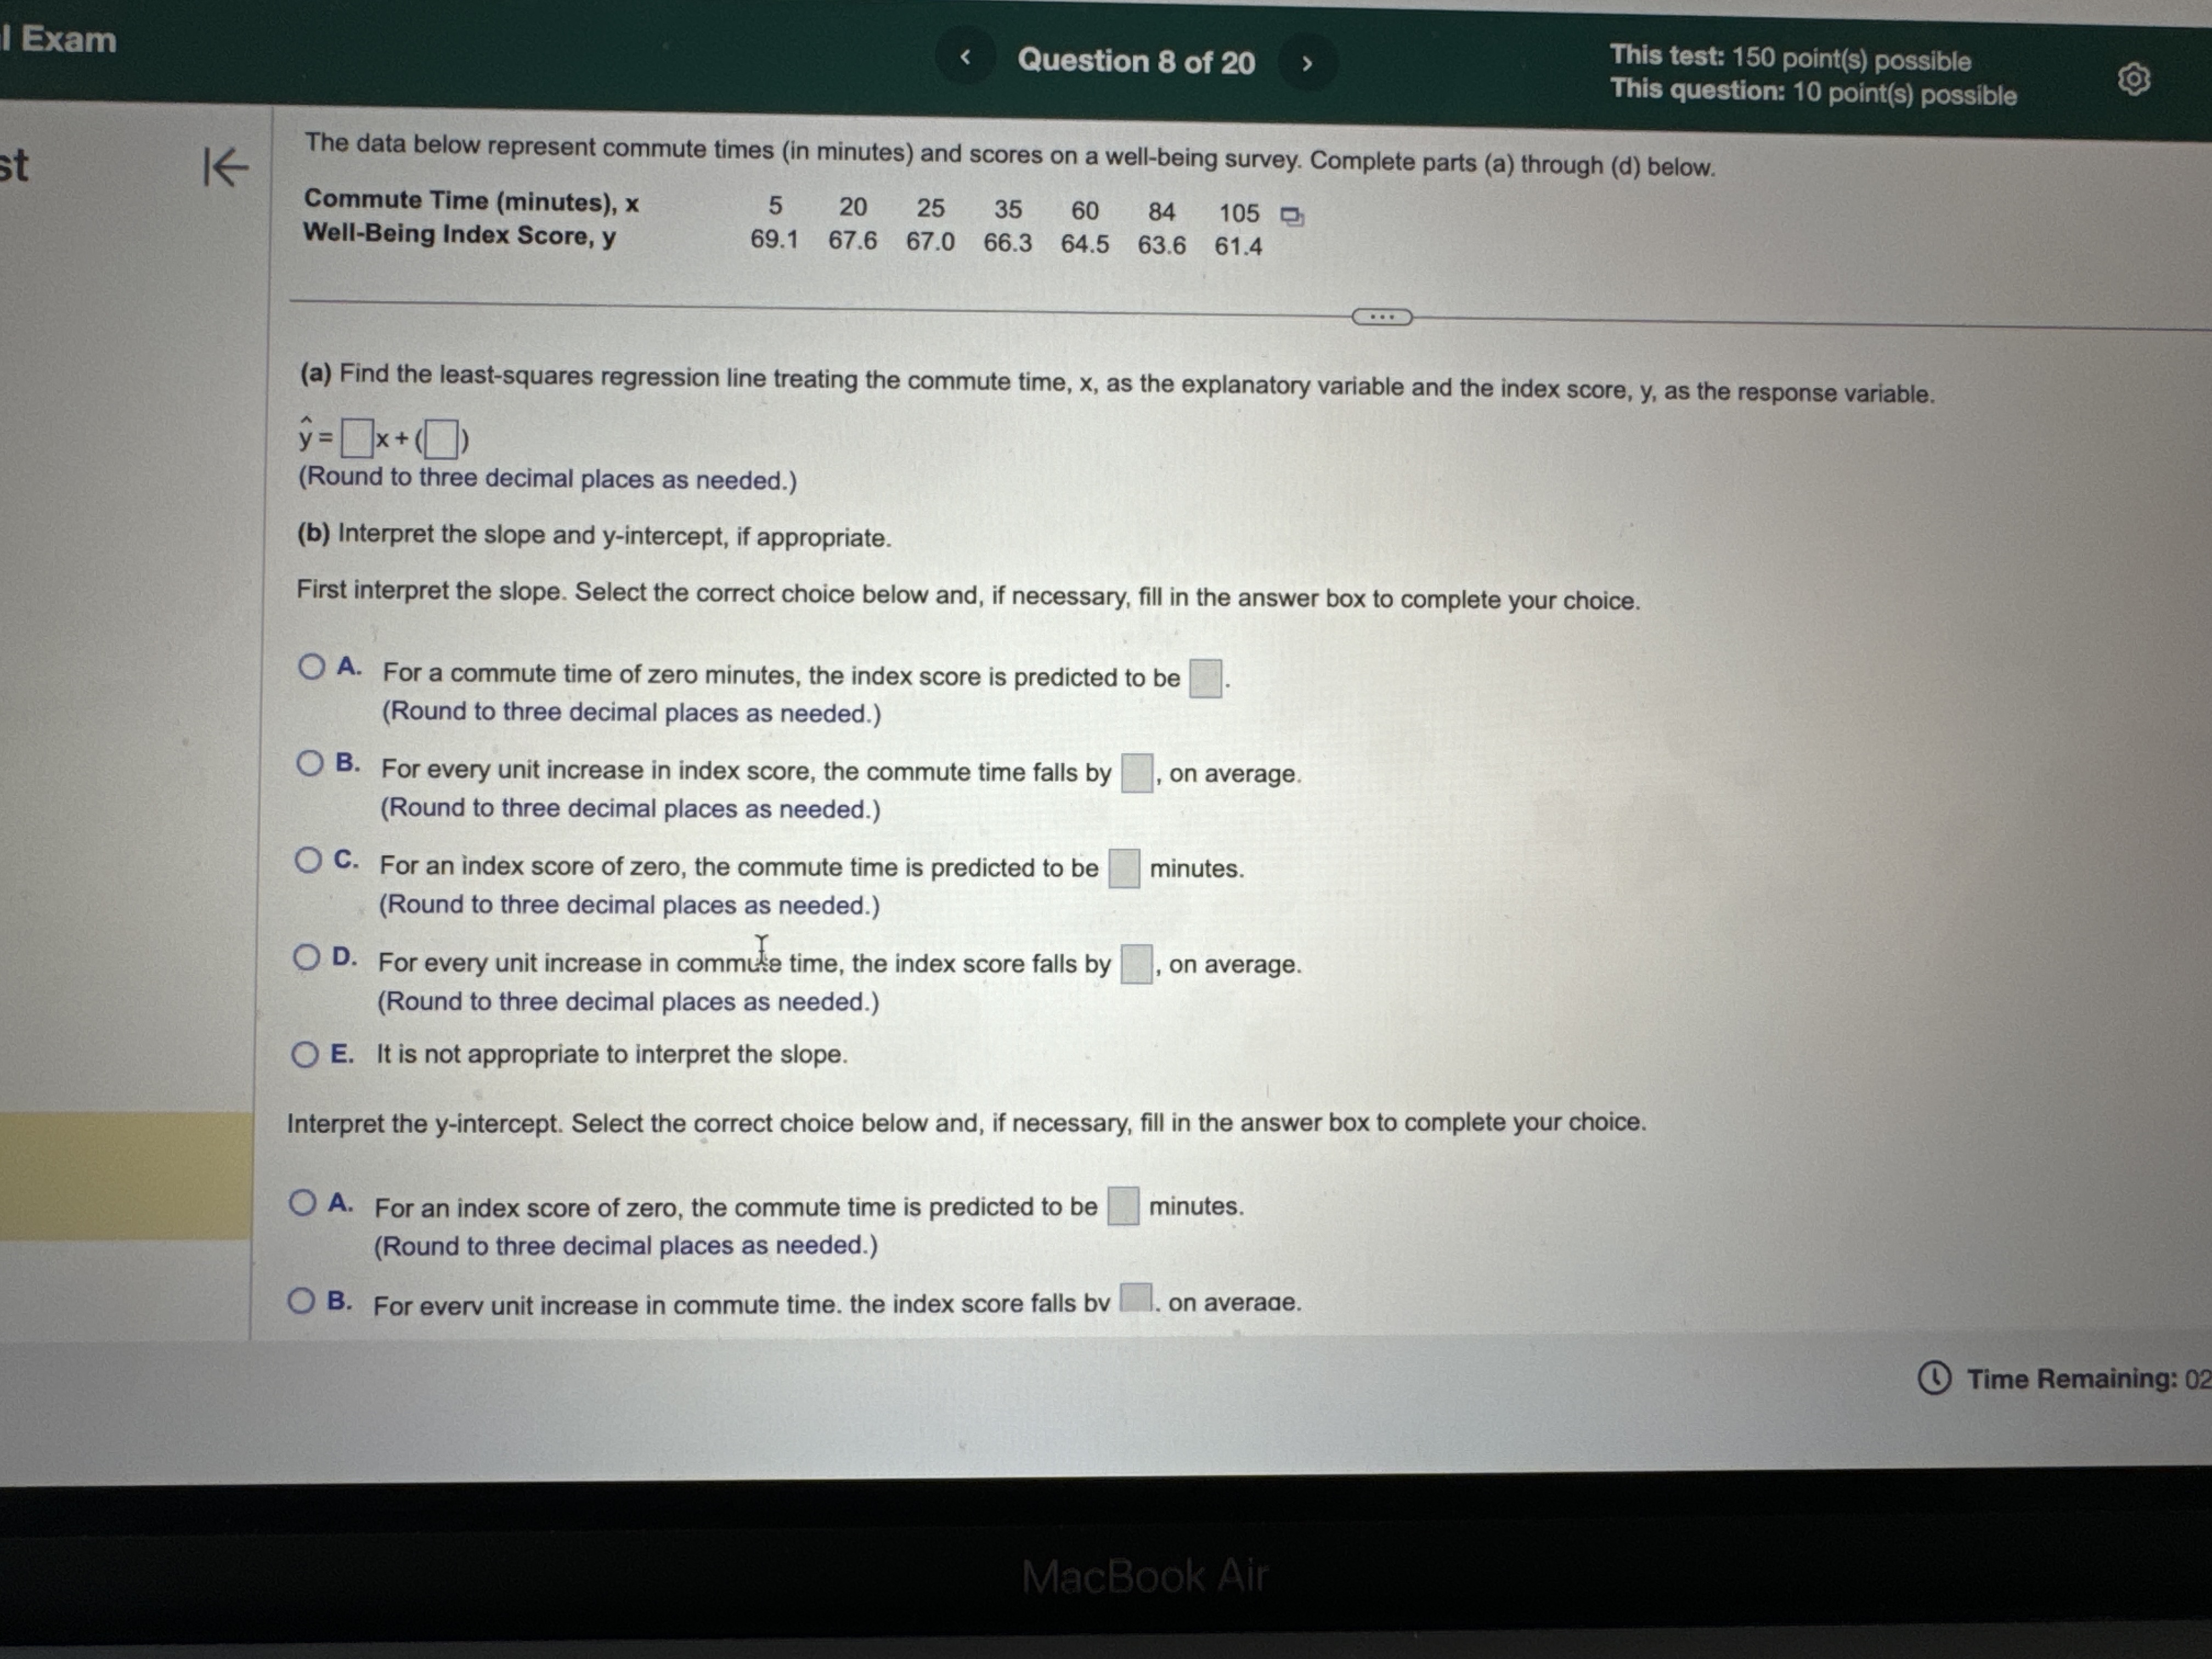
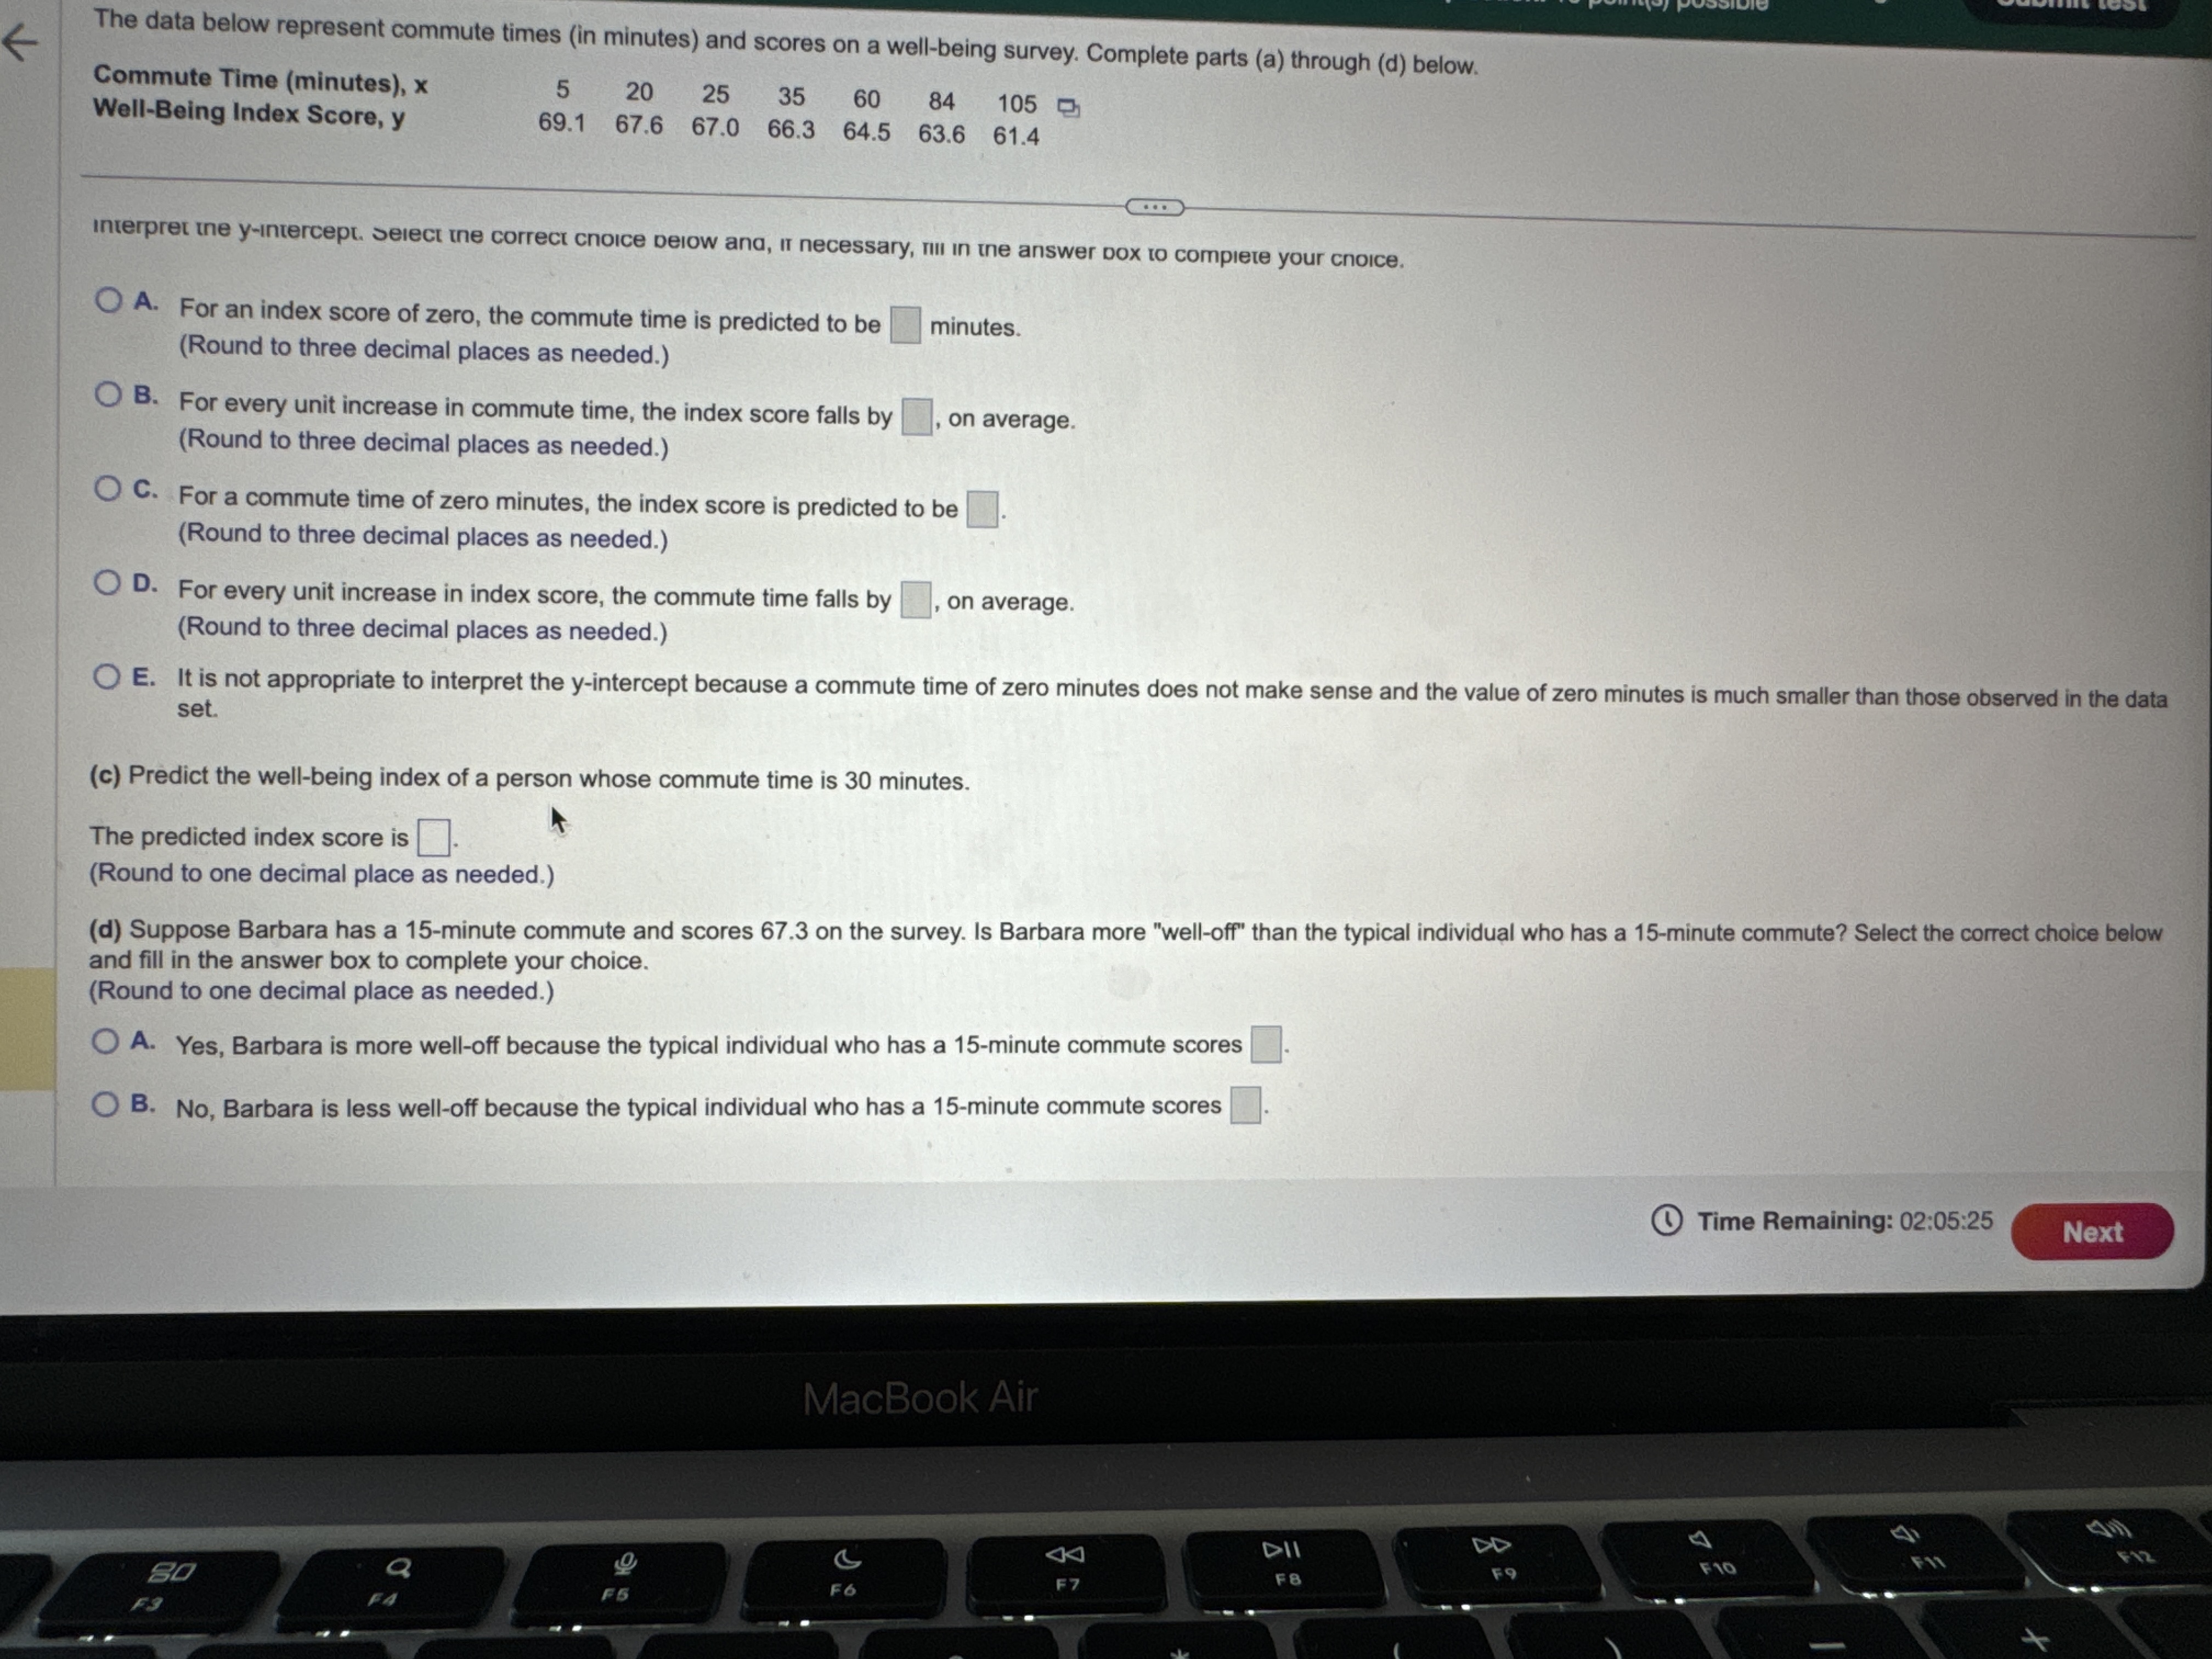
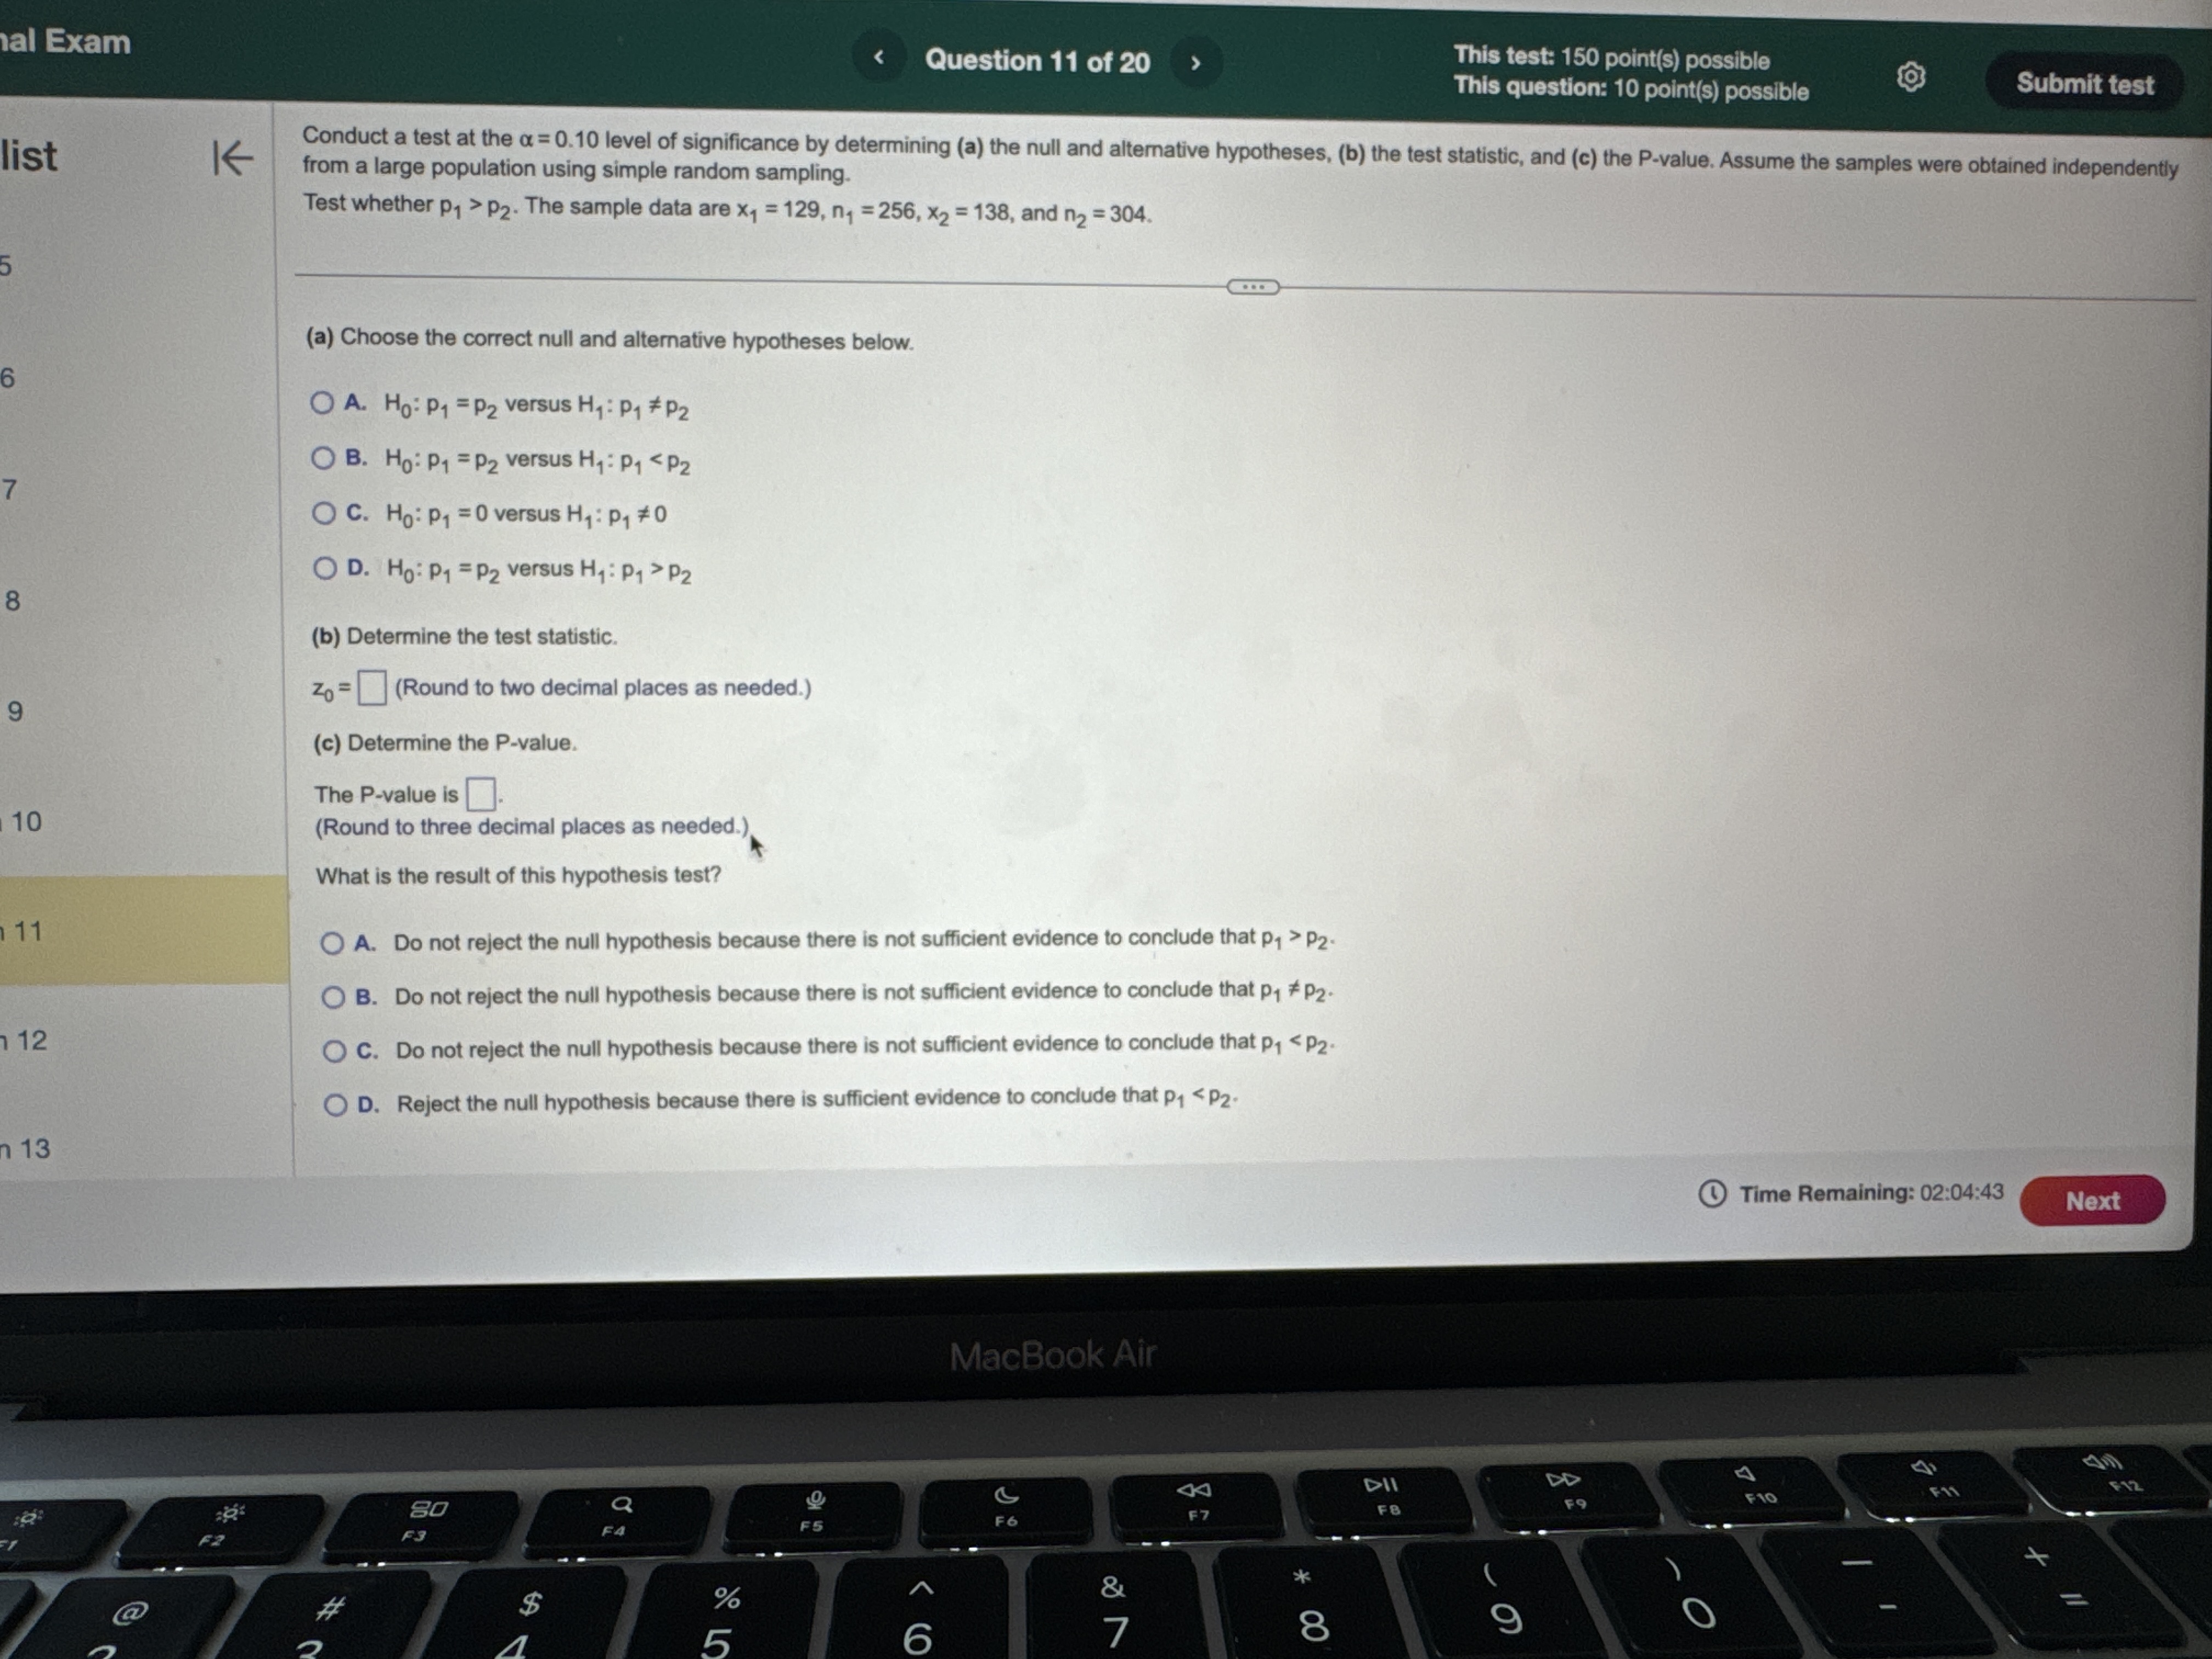
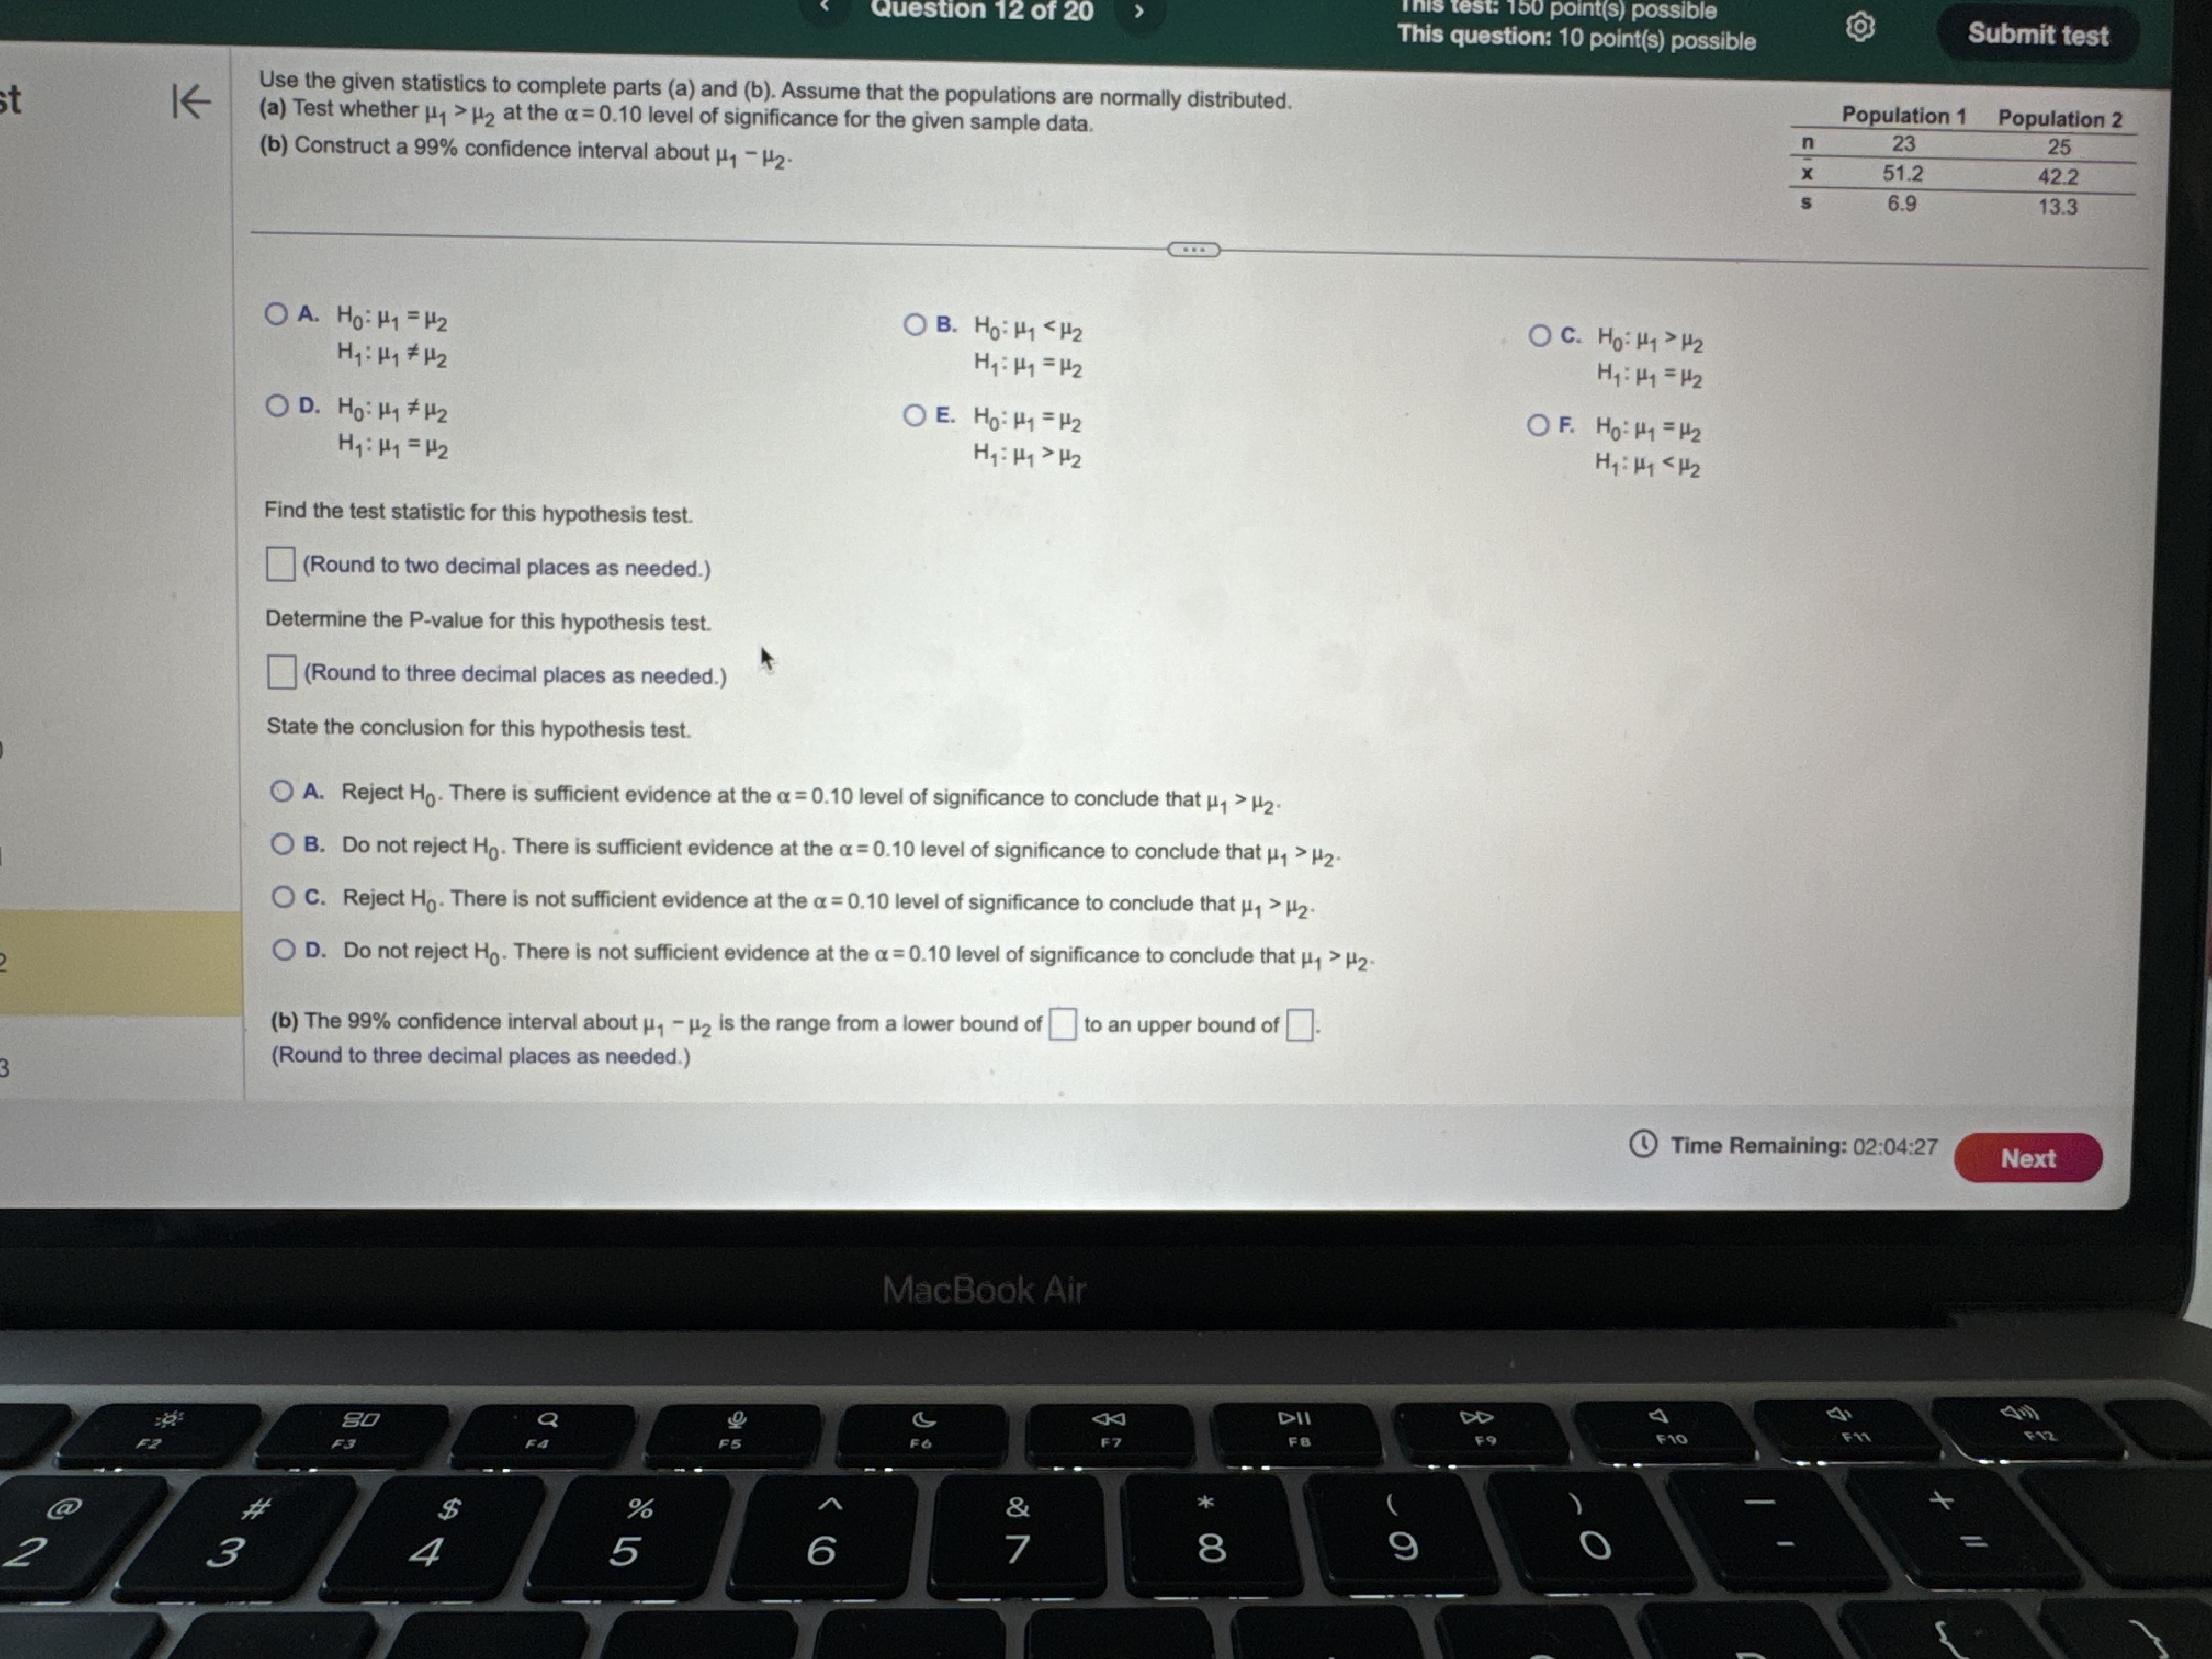
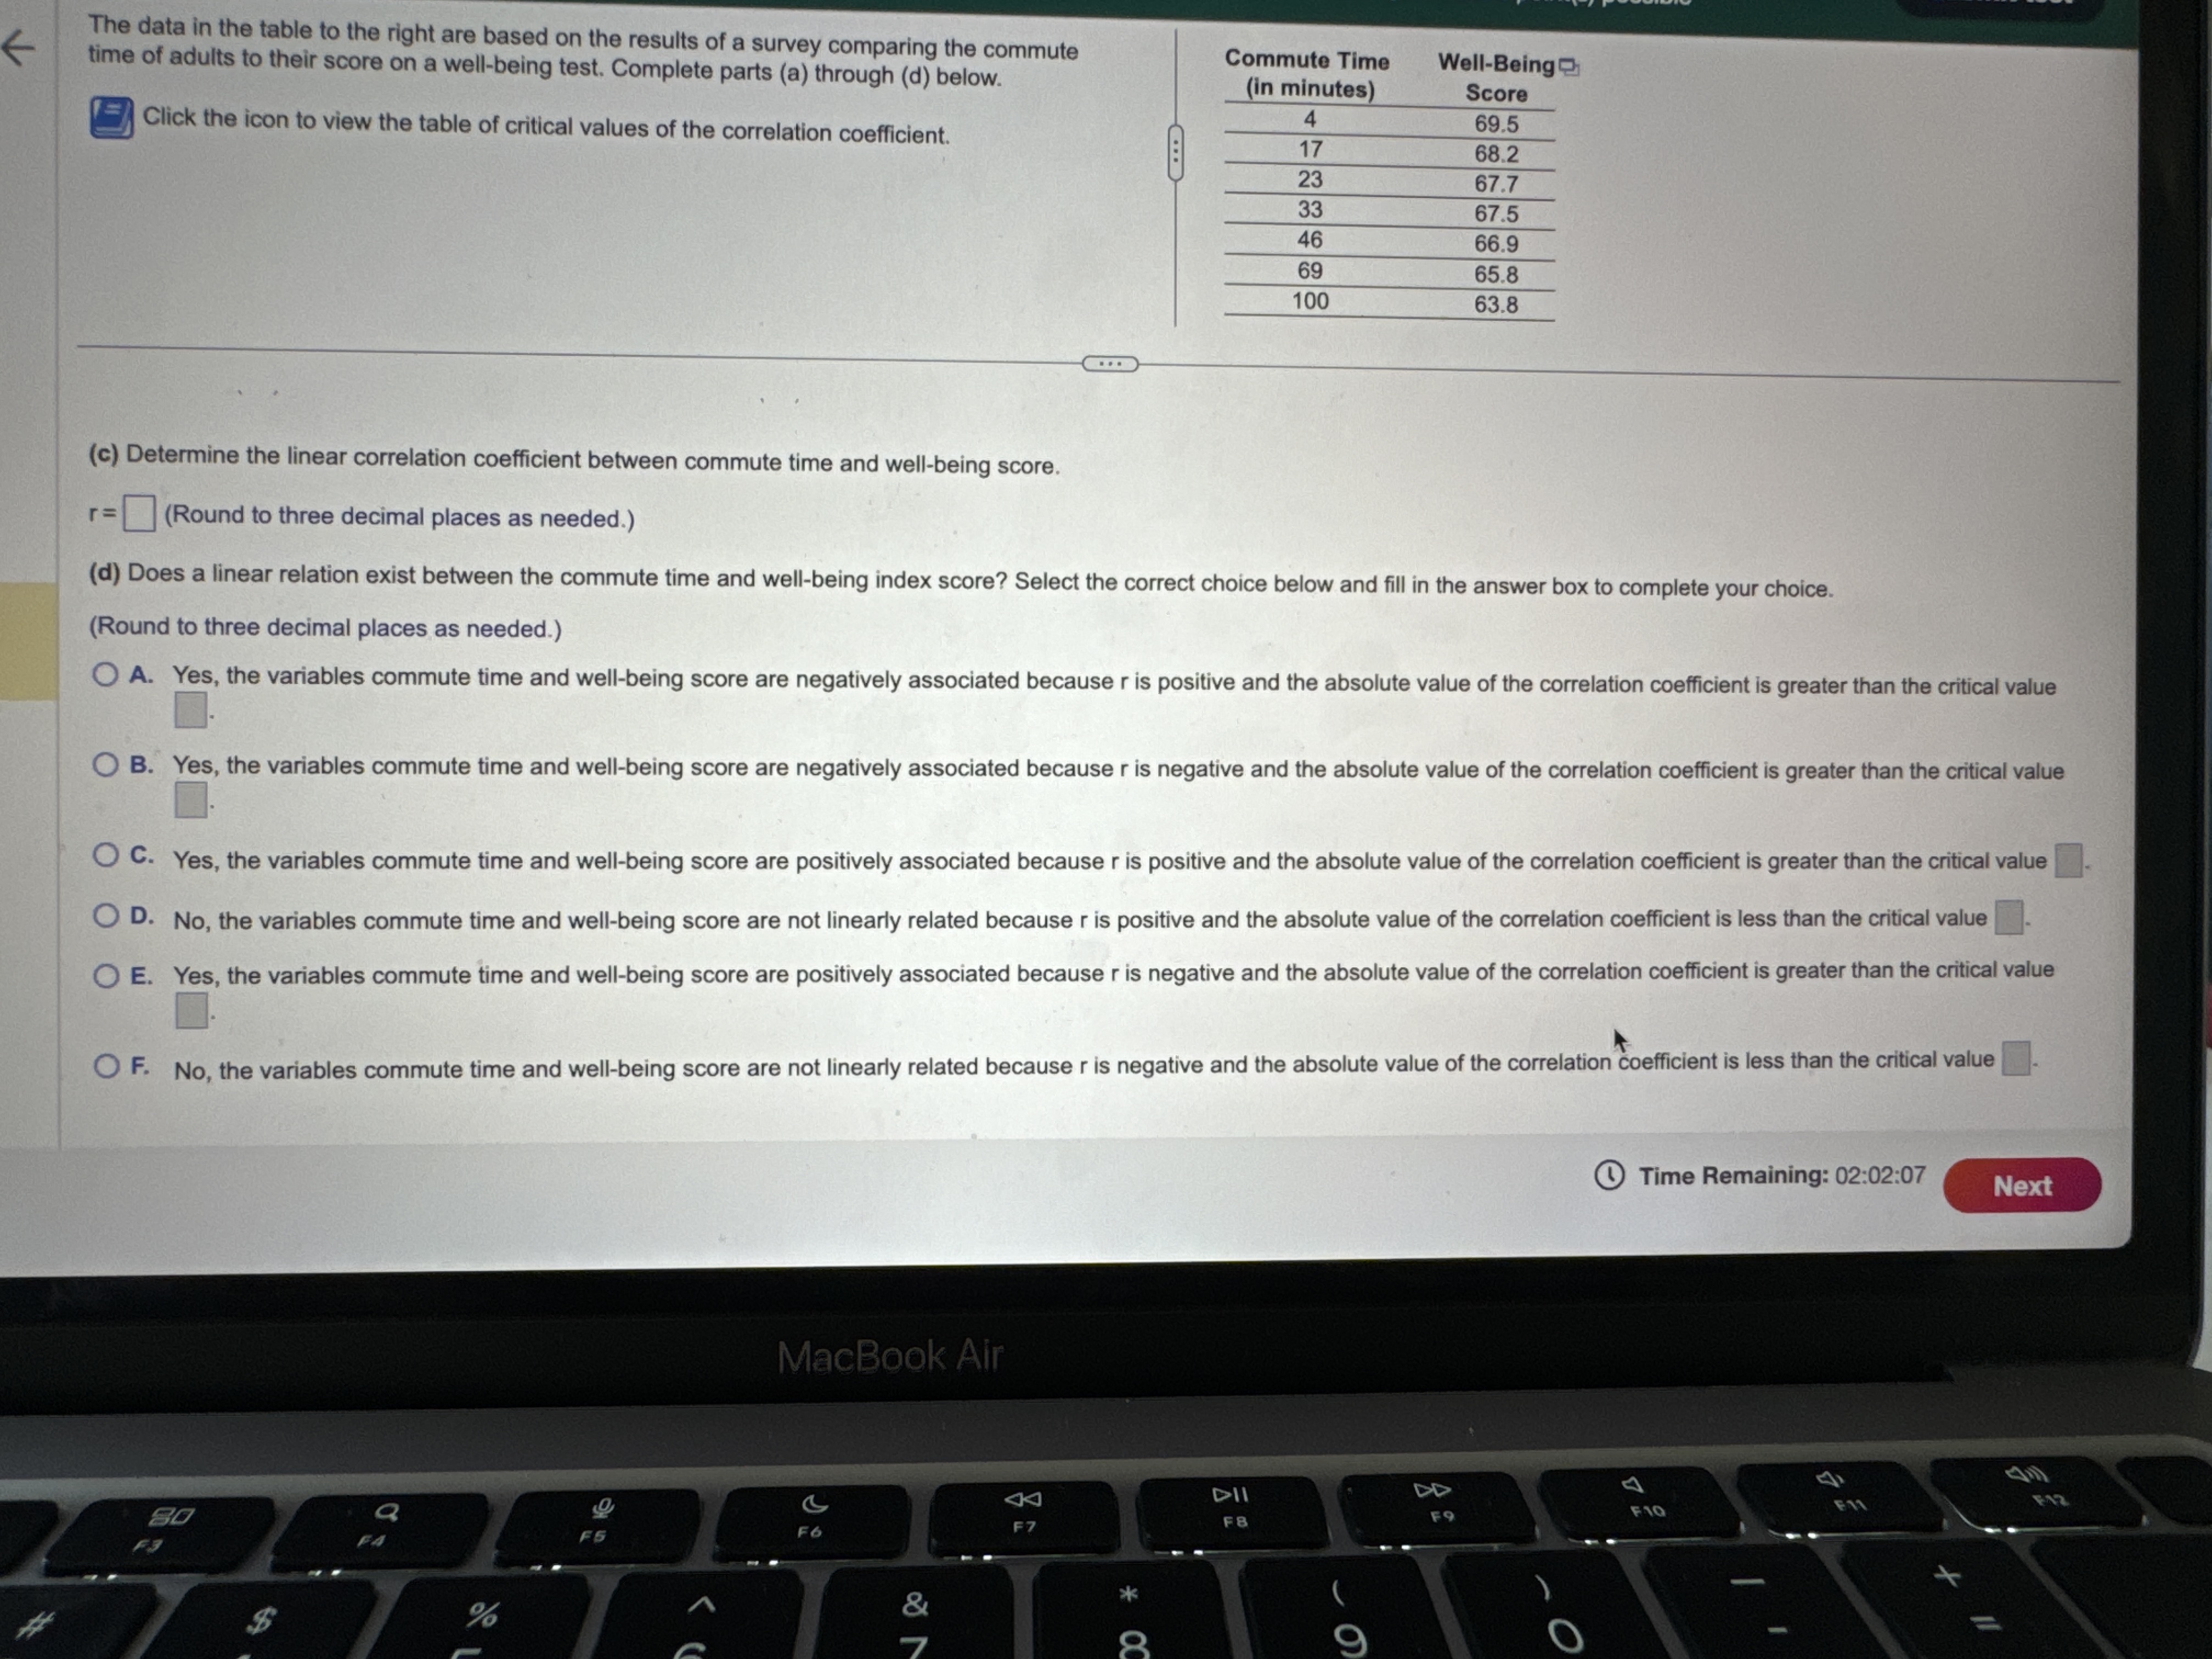
al Exam e T L L This test: 150 point(s) possible This question: 8 point(s) possible & EIL LR According to a certain government agency for a large country, the proportion of fatal traffic accidents in the country in which the driver had a positive blood alcohol concentration (BAC) is 0.39. Suppose a random sample of 113 traffic fatalities in a certain region results in 57 that involved a traffic F L c I positive BAC. Does the sample evidence i i proportion fatalities involving a positive BAC than the country at the a = 0.01 level of significance? 8 e e LS 3 B i = _ S 2 S 3 Because np, %1 = Po) = E}'IO. the sample size is [RER V| 5% of the population size, and the sample [ & V] the requirements for testing the hypothesis satisfied. (Round to one decimal place as needed.) What are the null and alternative hypotheses? r =T Ho: | [V V']versus H, ' V} Vl (Type integers or decimals. Do not round.) Find the test statistic, z, z5= j (Round to two decimal places as needed.) Find the P-value P-value = {L} (Round to three decimal places as needed.) Determine the conclusion for this hypothesis test. Choose the correct answer below A @ A. Since P-value a, do not reject the null hypothesis and conclude that there is not sufficient evidence that the region has a higher proportion of traffic fatalities involving a positive BAC than the country. O D. Since P-value > a, reject the null hypothesis and conclude that there is sufficient evidence that the region has a higher proportion of traffic fatalities involving a positive BAC than the country: R e e NGy @ Time Remaining: 02:06:03 m Exam Question 8 of 20 This test: 150 point(s) possible This question: 10 point(s) possible st K The data below represent commute times (in minutes) and scores on a well-being survey. Complete parts (a) through (d) below. Commute Time (minutes), x 5 20 25 35 60 84 105 Well-Being Index Score, y 69.1 67.6 67.0 66.3 64.5 63.6 61.4 (a) Find the least-squares regression line treating the commute time, x, as the explanatory variable and the index score, y, as the response variable. y = [ x + 0) (Round to three decimal places as needed.) (b) Interpret the slope and y-intercept, if appropriate. First interpret the slope. Select the correct choice below and, if necessary, fill in the answer box to complete your choice. A. For a commute time of zero minutes, the index score is predicted to be (Round to three decimal places as needed.) O B. For every unit increase in index score, the commute time falls by , on average. (Round to three decimal places as needed.) O C. For an index score of zero, the commute time is predicted to be minutes. (Round to three decimal places as needed.) O D. For every unit increase in commute time, the index score falls by , on average. (Round to three decimal places as needed.) O E. It is not appropriate to interpret the slope. Interpret the y-intercept. Select the correct choice below and, if necessary, fill in the answer box to complete your choice. O A. For an index score of zero, the commute time is predicted to be minutes. (Round to three decimal places as needed.) O B. For every unit increase in commute time. the index score falls bv . on average. Time Remaining: 02 MacBook AirThe data below represent commute times (in minutes) and scores on a well-being survey. Complete parts (a) through (d) below. Commute Time (minutes), x 5 20 25 35 60 84 105 Well-Being Index Score, y 69.1 67.6 67.0 66.3 64.5 63.6 61.4 interpret the y-intercept. Select the correct choice below and, IT necessary, fill in the answer box to complete your choice. A. For an index score of zero, the commute time is predicted to be minutes. (Round to three decimal places as needed.) O B. For every unit increase in commute time, the index score falls by , on average. Round to three decimal places as needed.) O C. For a commute time of zero minutes, the index score is predicted to be (Round to three decimal places as needed.) O D. For every unit increase in index score, the commute time falls by , on average. (Round to three decimal places as needed.) O E. It is not appropriate to interpret the y-intercept because a commute time of zero minutes does not make sense and the value of zero minutes is much smaller than those observed in the data set. (c) Predict the well-being index of a person whose commute time is 30 minutes. The predicted index score is. (Round to one decimal place as needed.) (d) Suppose Barbara has a 15-minute commute and scores 67.3 on the survey. Is Barbara more "well-off" than the typical individual who has a 15-minute commute? Select the correct choice below and fill in the answer box to complete your choice. (Round to one decimal place as needed.) O A. Yes, Barbara is more well-off because the typical individual who has a 15-minute commute scores O B. No, Barbara is less well-off because the typical individual who has a 15-minute commute scores Time Remaining: 02:05:25 Next MacBook Air A 44 DII DD F9 F10 Q F7 F6 F3al Exam Question 11 of 20 This test: 150 point(s) possible This question: 10 point(s) possible Submit test list K Conduct a test at the a = 0.10 level of significance by determining (a) the null and alternative hypotheses, (b) the test statistic, and (c) the P-value. Assume the samples were obtained independently from a large population using simple random sampling. Test whether P1 > P2. The sample data are x1 = 129, n, = 256, X2 = 138, and n2 = 304. (a) Choose the correct null and alternative hypotheses below. O A. Ho: P1 = P2 Versus H1 : P1 # P2 O B. Ho: P1 = P2 versus H1: P1 H2 Hy : Hy # H 2 Hy : My = H2 Hy: My = H2 OD. HO: My # H2 OE. HO: H1 = H2 OF. HO: Hy = H2 Hy: 141 = H2 H1 : 14 > H2 Hy: Hy
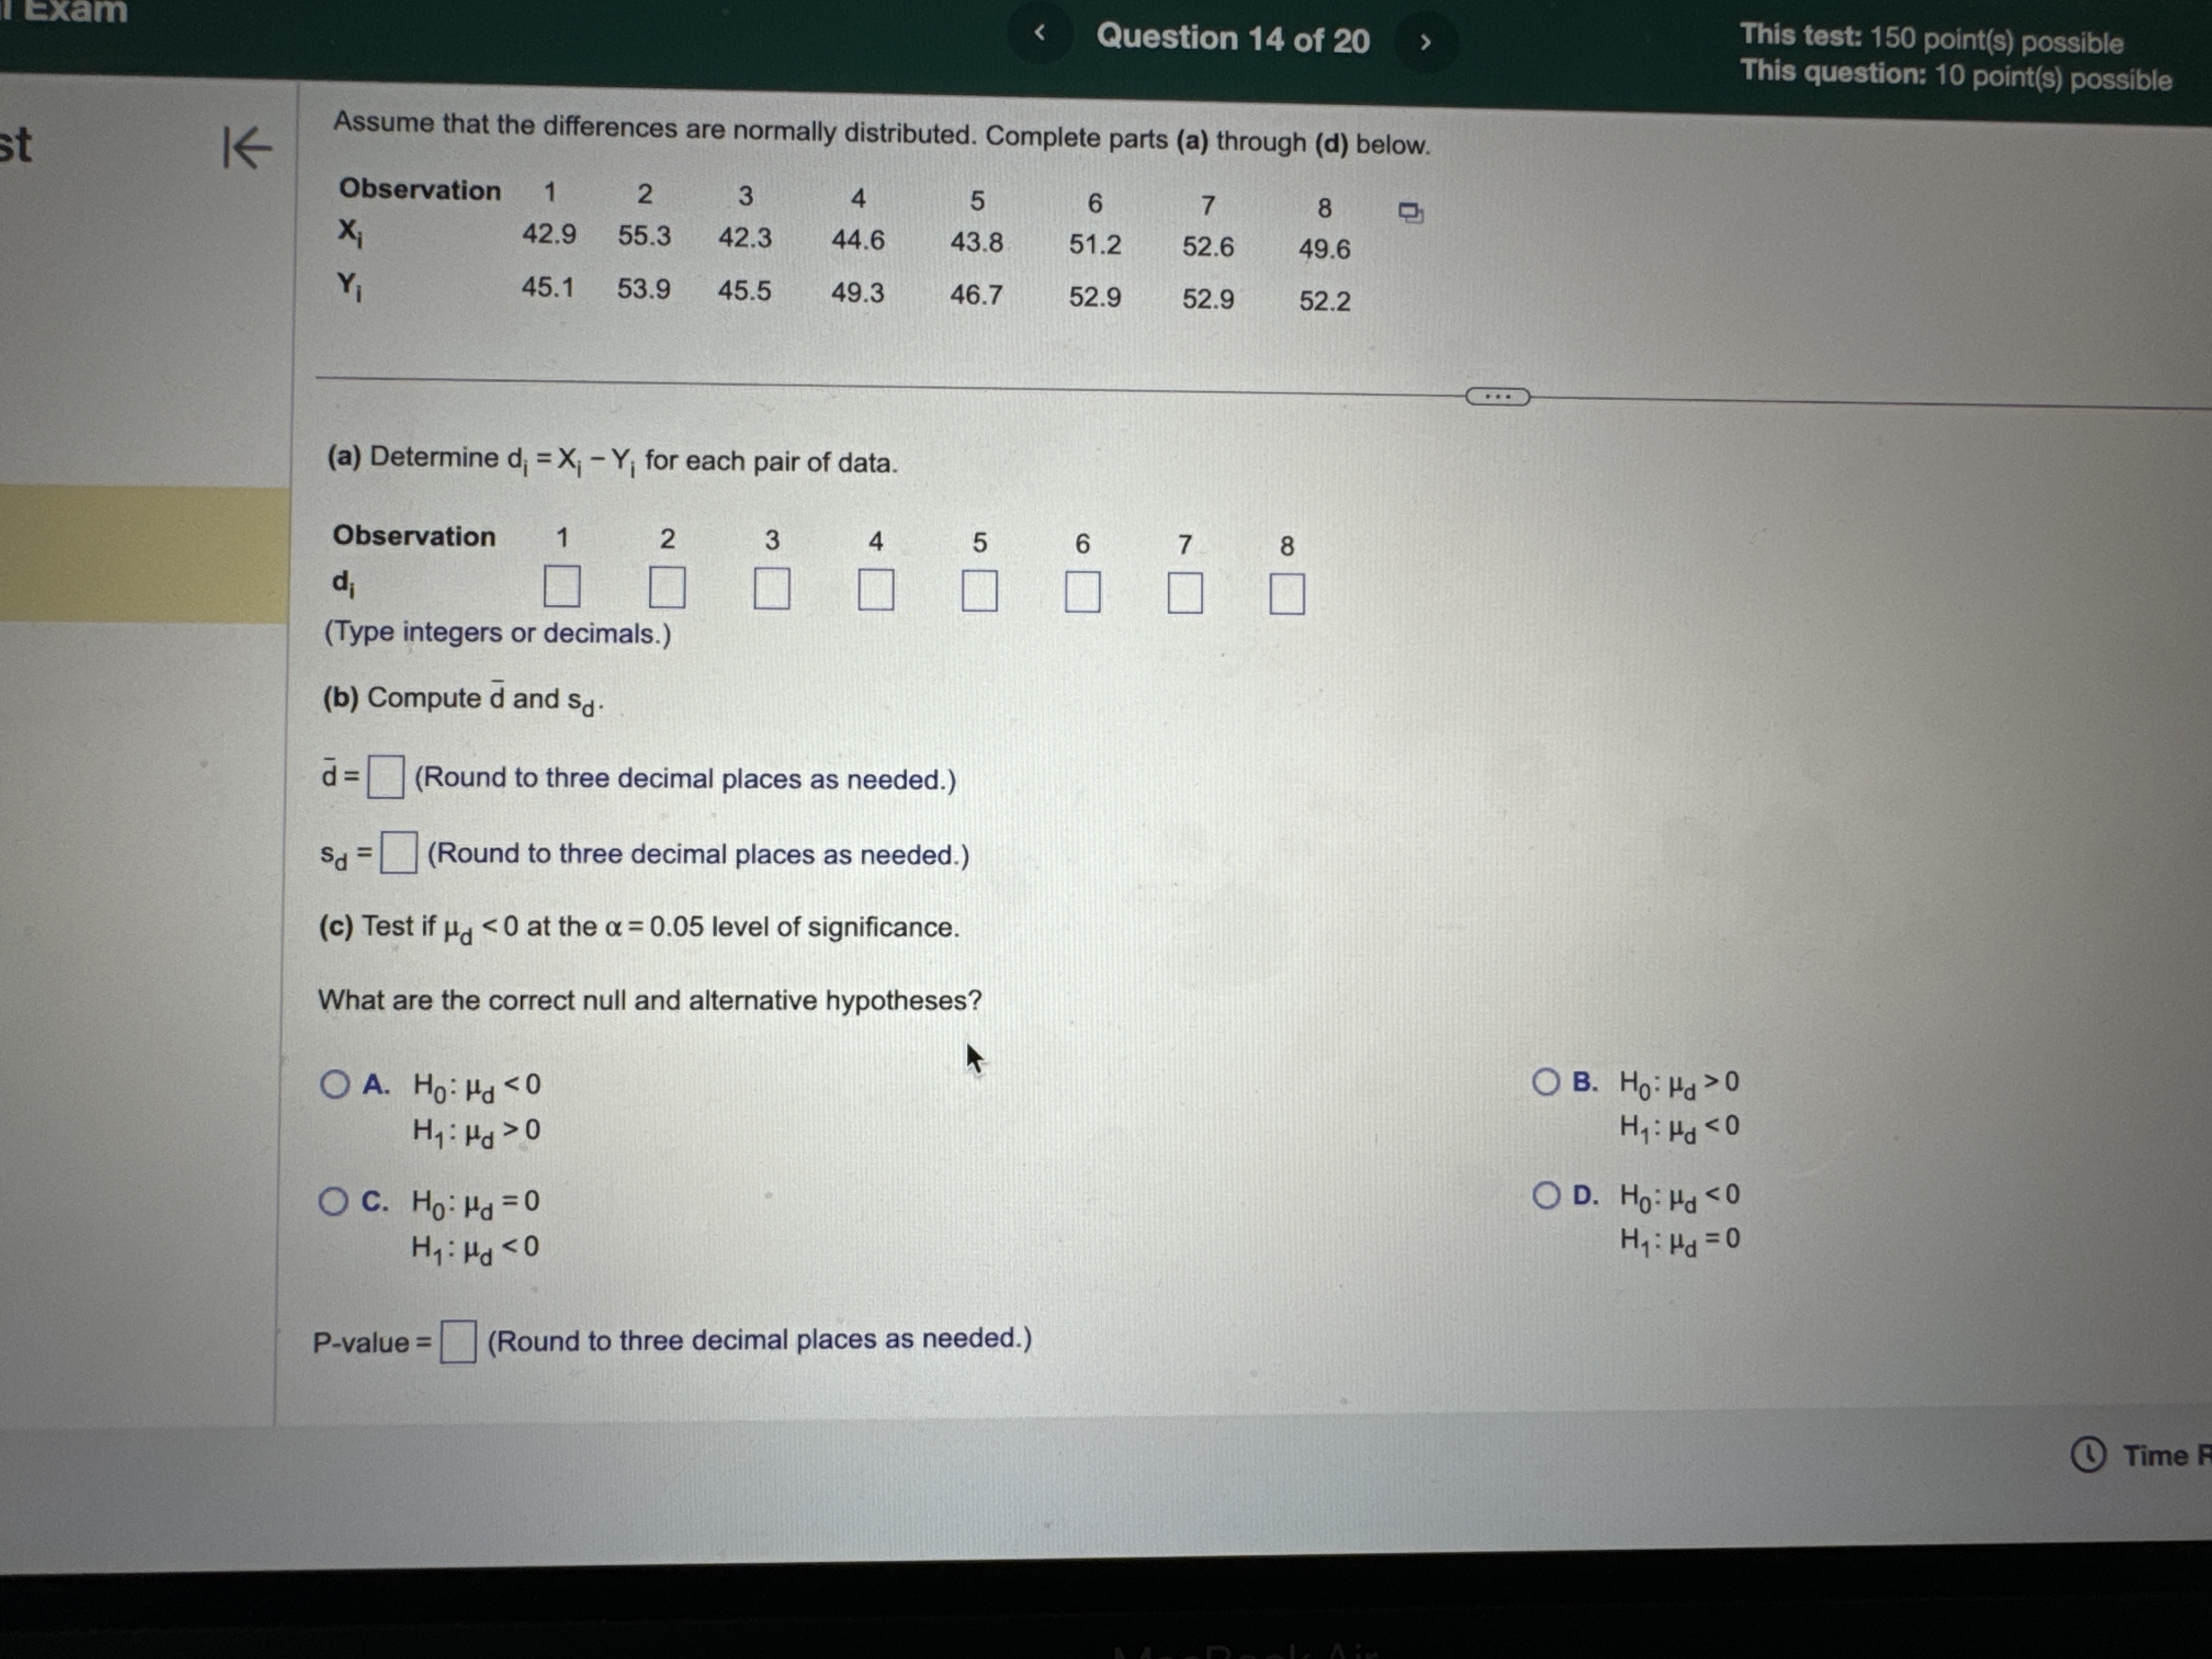
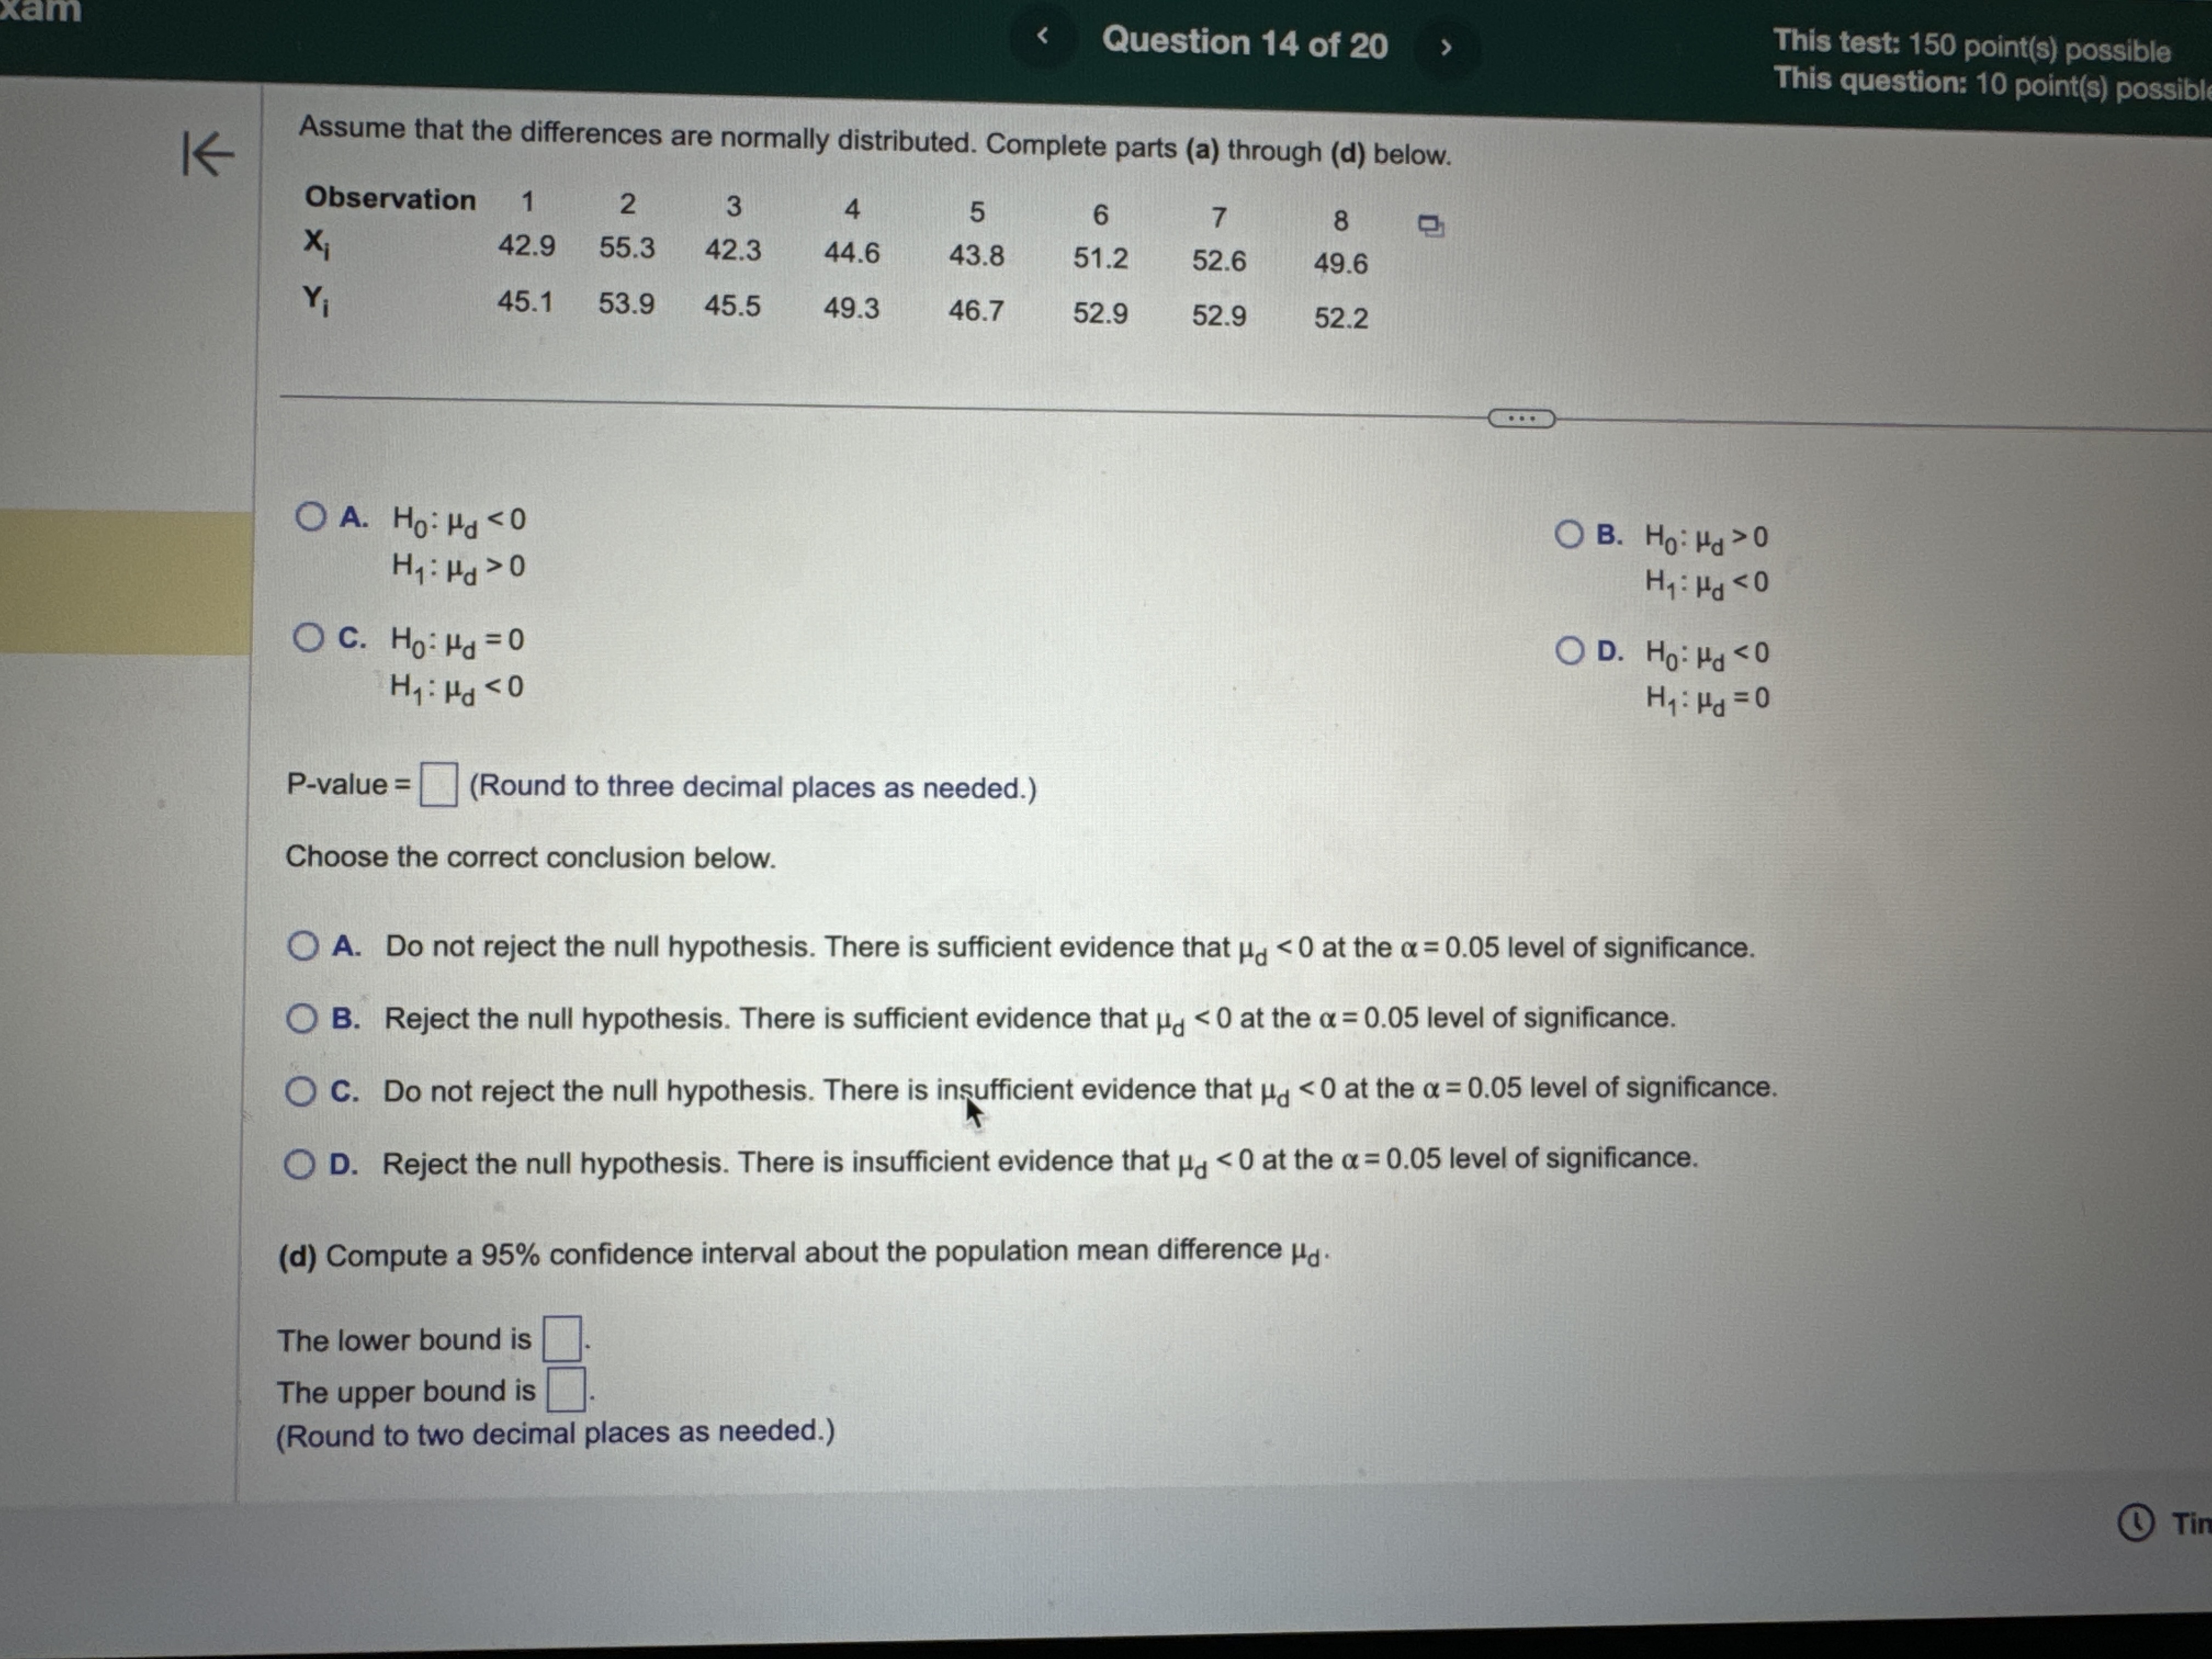
H2 O B. Do not reject Ho. There is sufficient evidence at the a = 0.10 level of significance to conclude that #1 > H2- O C. Reject Ho. There is not sufficient evidence at the a = 0.10 level of significance to conclude that #1 > H2. O D. Do not reject Ho. There is not sufficient evidence at the a = 0.10 level of significance to conclude that #1 > H2- (b) The 99% confidence interval about , - H2 is the range from a lower bound of to an upper bound of ]. (Round to three decimal places as needed.) Time Remaining: 02:04:27 Next MacBook Air A 44 F10 F11 80 S FO F7 FA @ % O 4 5 6 8 9Exam Question 14 of 20 This test: 150 point(s) possible This question: 10 point(s) possible Assume that the differences are normally distributed. Complete parts (a) through (d) below. st K Observation 1 2 3 5 6 8 X 42.9 55.3 42.3 44.6 43.8 51.2 52.6 49.6 45.1 53.9 45.5 49.3 46.7 52.9 52.9 52.2 (a) Determine di = X; - Y; for each pair of data. Observation di (Type integers or decimals.) (b) Compute d and sd. d = (Round to three decimal places as needed.) Sd = (Round to three decimal places as needed.) (c) Test if Ha 0 OA. Ho: Hd
Step by Step Solution
There are 3 Steps involved in it

Get step-by-step solutions from verified subject matter experts