

Question: a).Label the confidence interval graph given below. Using insert-shapes draw the lines where the critical values should appear for the % chosen above. Indicate the

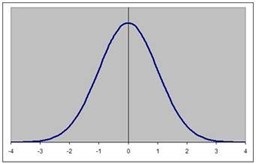
a).Label the confidence interval graph given below. Using insert-shapes draw the lines where the critical values should appear for the % chosen above. Indicate the critical values below the graph and label the area for the tails. Click on any line before the graph on the left and space over to record the data on the graph.
Step by Step Solution
There are 3 Steps involved in it
1 Expert Approved Answer
Step: 1 Unlock

Question Has Been Solved by an Expert!
Get step-by-step solutions from verified subject matter experts
Step: 2 Unlock
Step: 3 Unlock