

Question: Alani has 80 hours per week that she can devote to time spent working or on leisure activities. Assume that Alani is paid by the
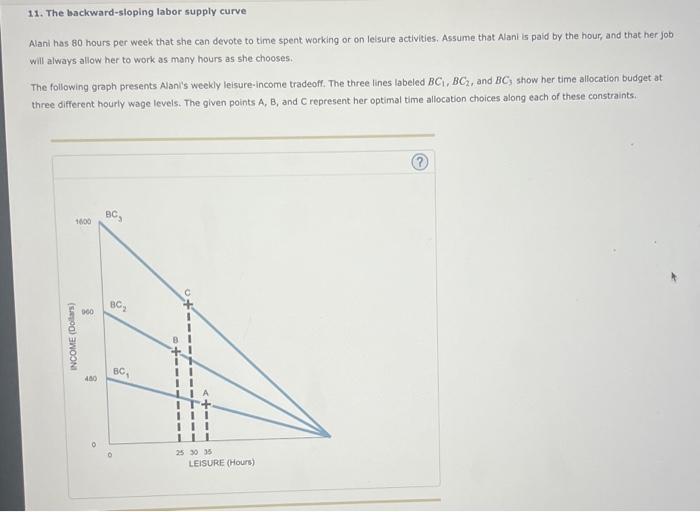
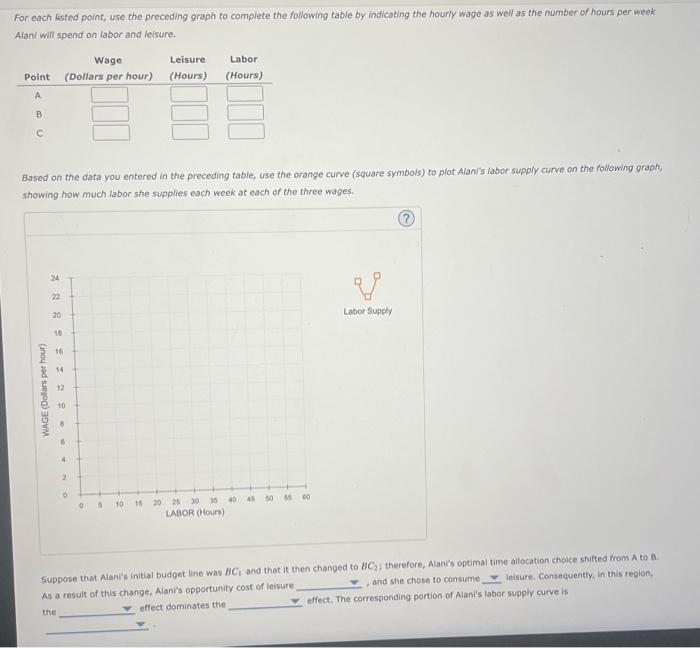
11. The backward-sloping labor supply curve Alani has 80 hours per week that she can devote to time spent working or on lelsure activities. Assume that Alani is paid by the hour, and that her job will always allow her to work as many hours as she chooses. The following graph presents Alani's weekly leisure-income tradeoff, The three lines labeled BC1,BC2, and BC3 show her time allocation budget at three different hourly wage levels. The given points A,B, and C represent her optimal time allocation choices along each of these constraints. For each listed point, use the preceding graph to complete the following table by indicating the hourly wage as well as the number of hours per week Alani wil spend on labor and leisure. Based on the data you entered in the preceding table, use the orange curve (square symbols) to plot Alani's labor supply curve on the following graph, showing how much labor she supplies each week at each of the three wages. Suppose that Alant's initial budget line was BC, and that it then changed to BC2, therefore, Alani's optimal time allocation cheice shifted from A to 8. As a resuit of this change, Alani's opportunity cost of leisure and she chose to consume leisure. Consequently, in this region, the effect dominates the effect. The corresponding portion of Alani's labor supply curve is
Step by Step Solution
There are 3 Steps involved in it

Get step-by-step solutions from verified subject matter experts