

Question: Alf changes saved m g 1. (05.02 MC) A district manager rewards sales teams based on overall sales generated in a month. The data for
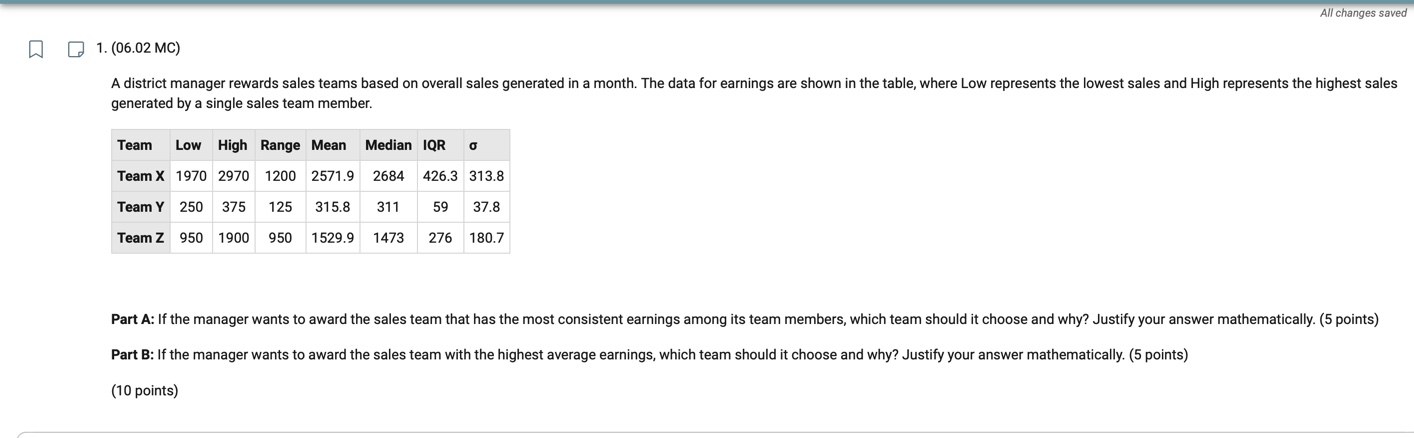
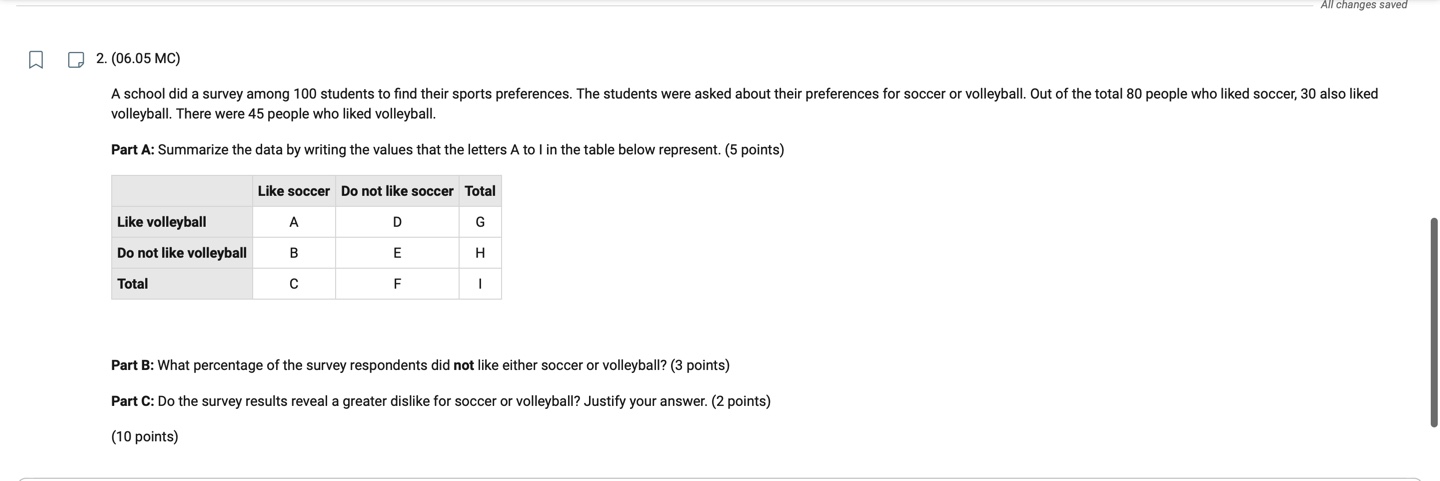
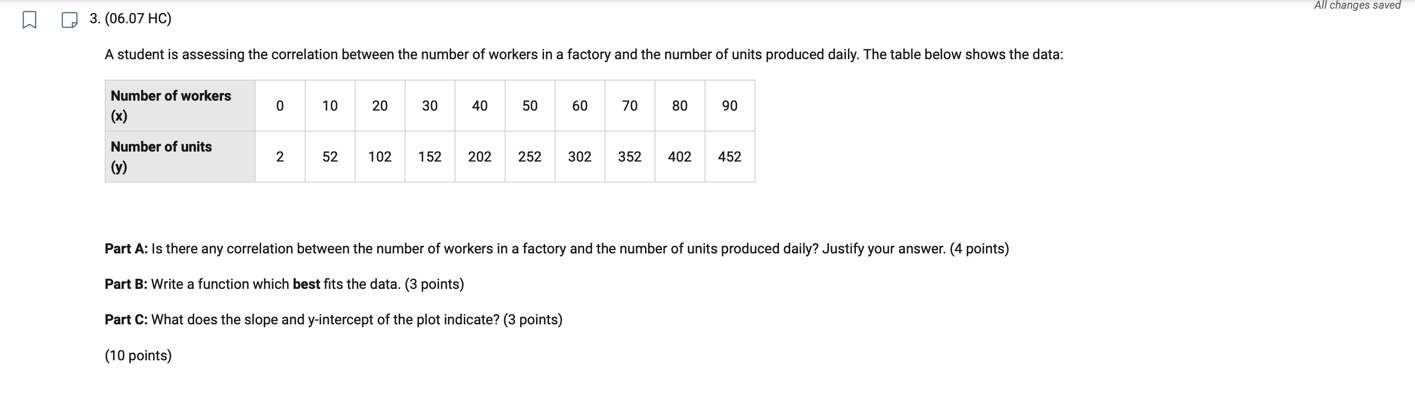
Alf changes saved m g 1. (05.02 MC) A district manager rewards sales teams based on overall sales generated in a month. The data for earnings are shown In the table. where Low represents the lowest sales and High represents the highest sales generated by a single sales team member. Team Low High Rama Mean Median IQR a Team] 1970 2970 1200 2511.9 2684 426.3 313.8 Tale 250 375 125 315.8 311 59 37.5 Team! 950 1900 950 1529.9 1473 276 180.? Part A: If the manager wants to award the sales team that has the most consistent earnings among its team members, which team should it choose and why? Justify your answer mathematically. (5 points) Part; B: lfthe manager wants to award the sales team with the highest average earnings. which team should it choose and why? Justify your answer mathematically. [5 points) [10 points) All changes saved D g 2105.95 MC) A school did a survey among 100 students to nd their sports preferences. The students were asked about their preferences for soccer or volleyball. Out of the total 80 people who liked soccer, 30 also liked volleyball. There were 45 people who liked volleyball. PartA: Summarize the data by writing the values that the letlers A to I in the table below represent. (5 points) Like soccer Do not like soccer Total um volleyball A n G Do not like volleyball B E H Total C F I Part B: What percentage 0! the survey respondents did not like either soccer or volleyball? (3 points} Part 6: Do the survey results reveal a greater dislike for soccer or volleyball? Justify your answer. (2 points} (10 points) All changes saved m g 3. (05.07 HE) A student is assessing the correlation between the number of workers in a factory and the number at units produced daily. The table below shows the data: :gmmmm" a 10 20 30 4o 50 an m an 90 :gmwm\" 2 52 102 152 202 252 302 352 402 452 Part A: Is there any correlation between the number of workers in a factory and the number of units produced daily? Justify your answer (4 points) Part 3: Write a tunction which best fits the data. (3 points) Part C: What does the slope and y-intercept of the plot indicate? (3 points) (1 a points)
Step by Step Solution
There are 3 Steps involved in it

Get step-by-step solutions from verified subject matter experts