

Question: Algebra 1 Part B 50 points Module 6.06 Scatter Plots Measure your own height and arm span (from finger-tip to finger-tip) in inches. You will
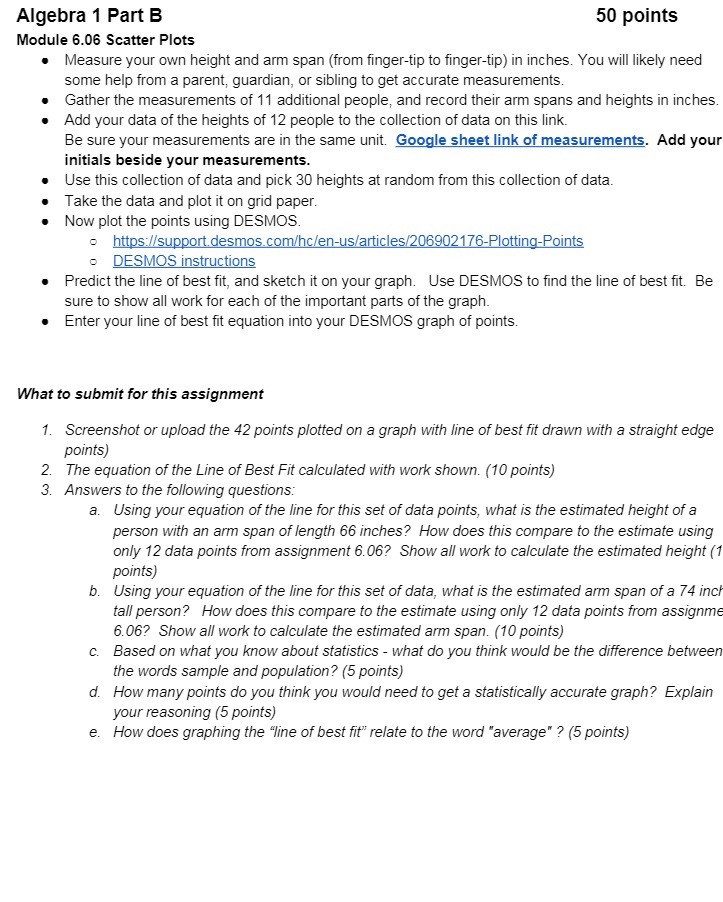
Algebra 1 Part B 50 points Module 6.06 Scatter Plots Measure your own height and arm span (from finger-tip to finger-tip) in inches. You will likely need some help from a parent, guardian, or sibling to get accurate measurements. Gather the measurements of 11 additional people, and record their arm spans and heights in inches Add your data of the heights of 12 people to the collection of data on this link. Be sure your measurements are in the same unit. Google sheet link of measurements. Add your initials beside your measurements. Use this collection of data and pick 30 heights at random from this collection of data. Take the data and plot it on grid paper. Now plot the points using DESMOS https://support.desmos.com/hc/en-us/articles/206902176-Plotting-Points DESMOS instructions Predict the line of best fit, and sketch it on your graph. Use DESMOS to find the line of best fit. Be sure to show all work for each of the important parts of the graph. Enter your line of best fit equation into your DESMOS graph of points. What to submit for this assignment 1. Screenshot or upload the 42 points plotted on a graph with line of best fit drawn with a straight edge points) 2. The equation of the Line of Best Fit calculated with work shown. (10 points) 3. Answers to the following questions. a. Using your equation of the line for this set of data points, what is the estimated height of a person with an arm span of length 66 inches? How does this compare to the estimate using only 12 data points from assignment 6.06? Show all work to calculate the estimated height (1 points) b. Using your equation of the line for this set of data, what is the estimated arm span of a 74 inc tall person? How does this compare to the estimate using only 12 data points from assignme 6.06? Show all work to calculate the estimated arm span. (10 points) C. Based on what you know about statistics - what do you think would be the difference between the words sample and population? (5 points) d. How many points do you think you would need to get a statistically accurate graph? Explain your reasoning (5 points) e. How does graphing the "line of best fit" relate to the word "average" ? (5 points)
Step by Step Solution
There are 3 Steps involved in it

Get step-by-step solutions from verified subject matter experts