

Question: Algebra 1B Unit 9 Practice 5 Name 1. it Now there are six scatter plots, six correlation coefficients, and six terms. Under each graph determine
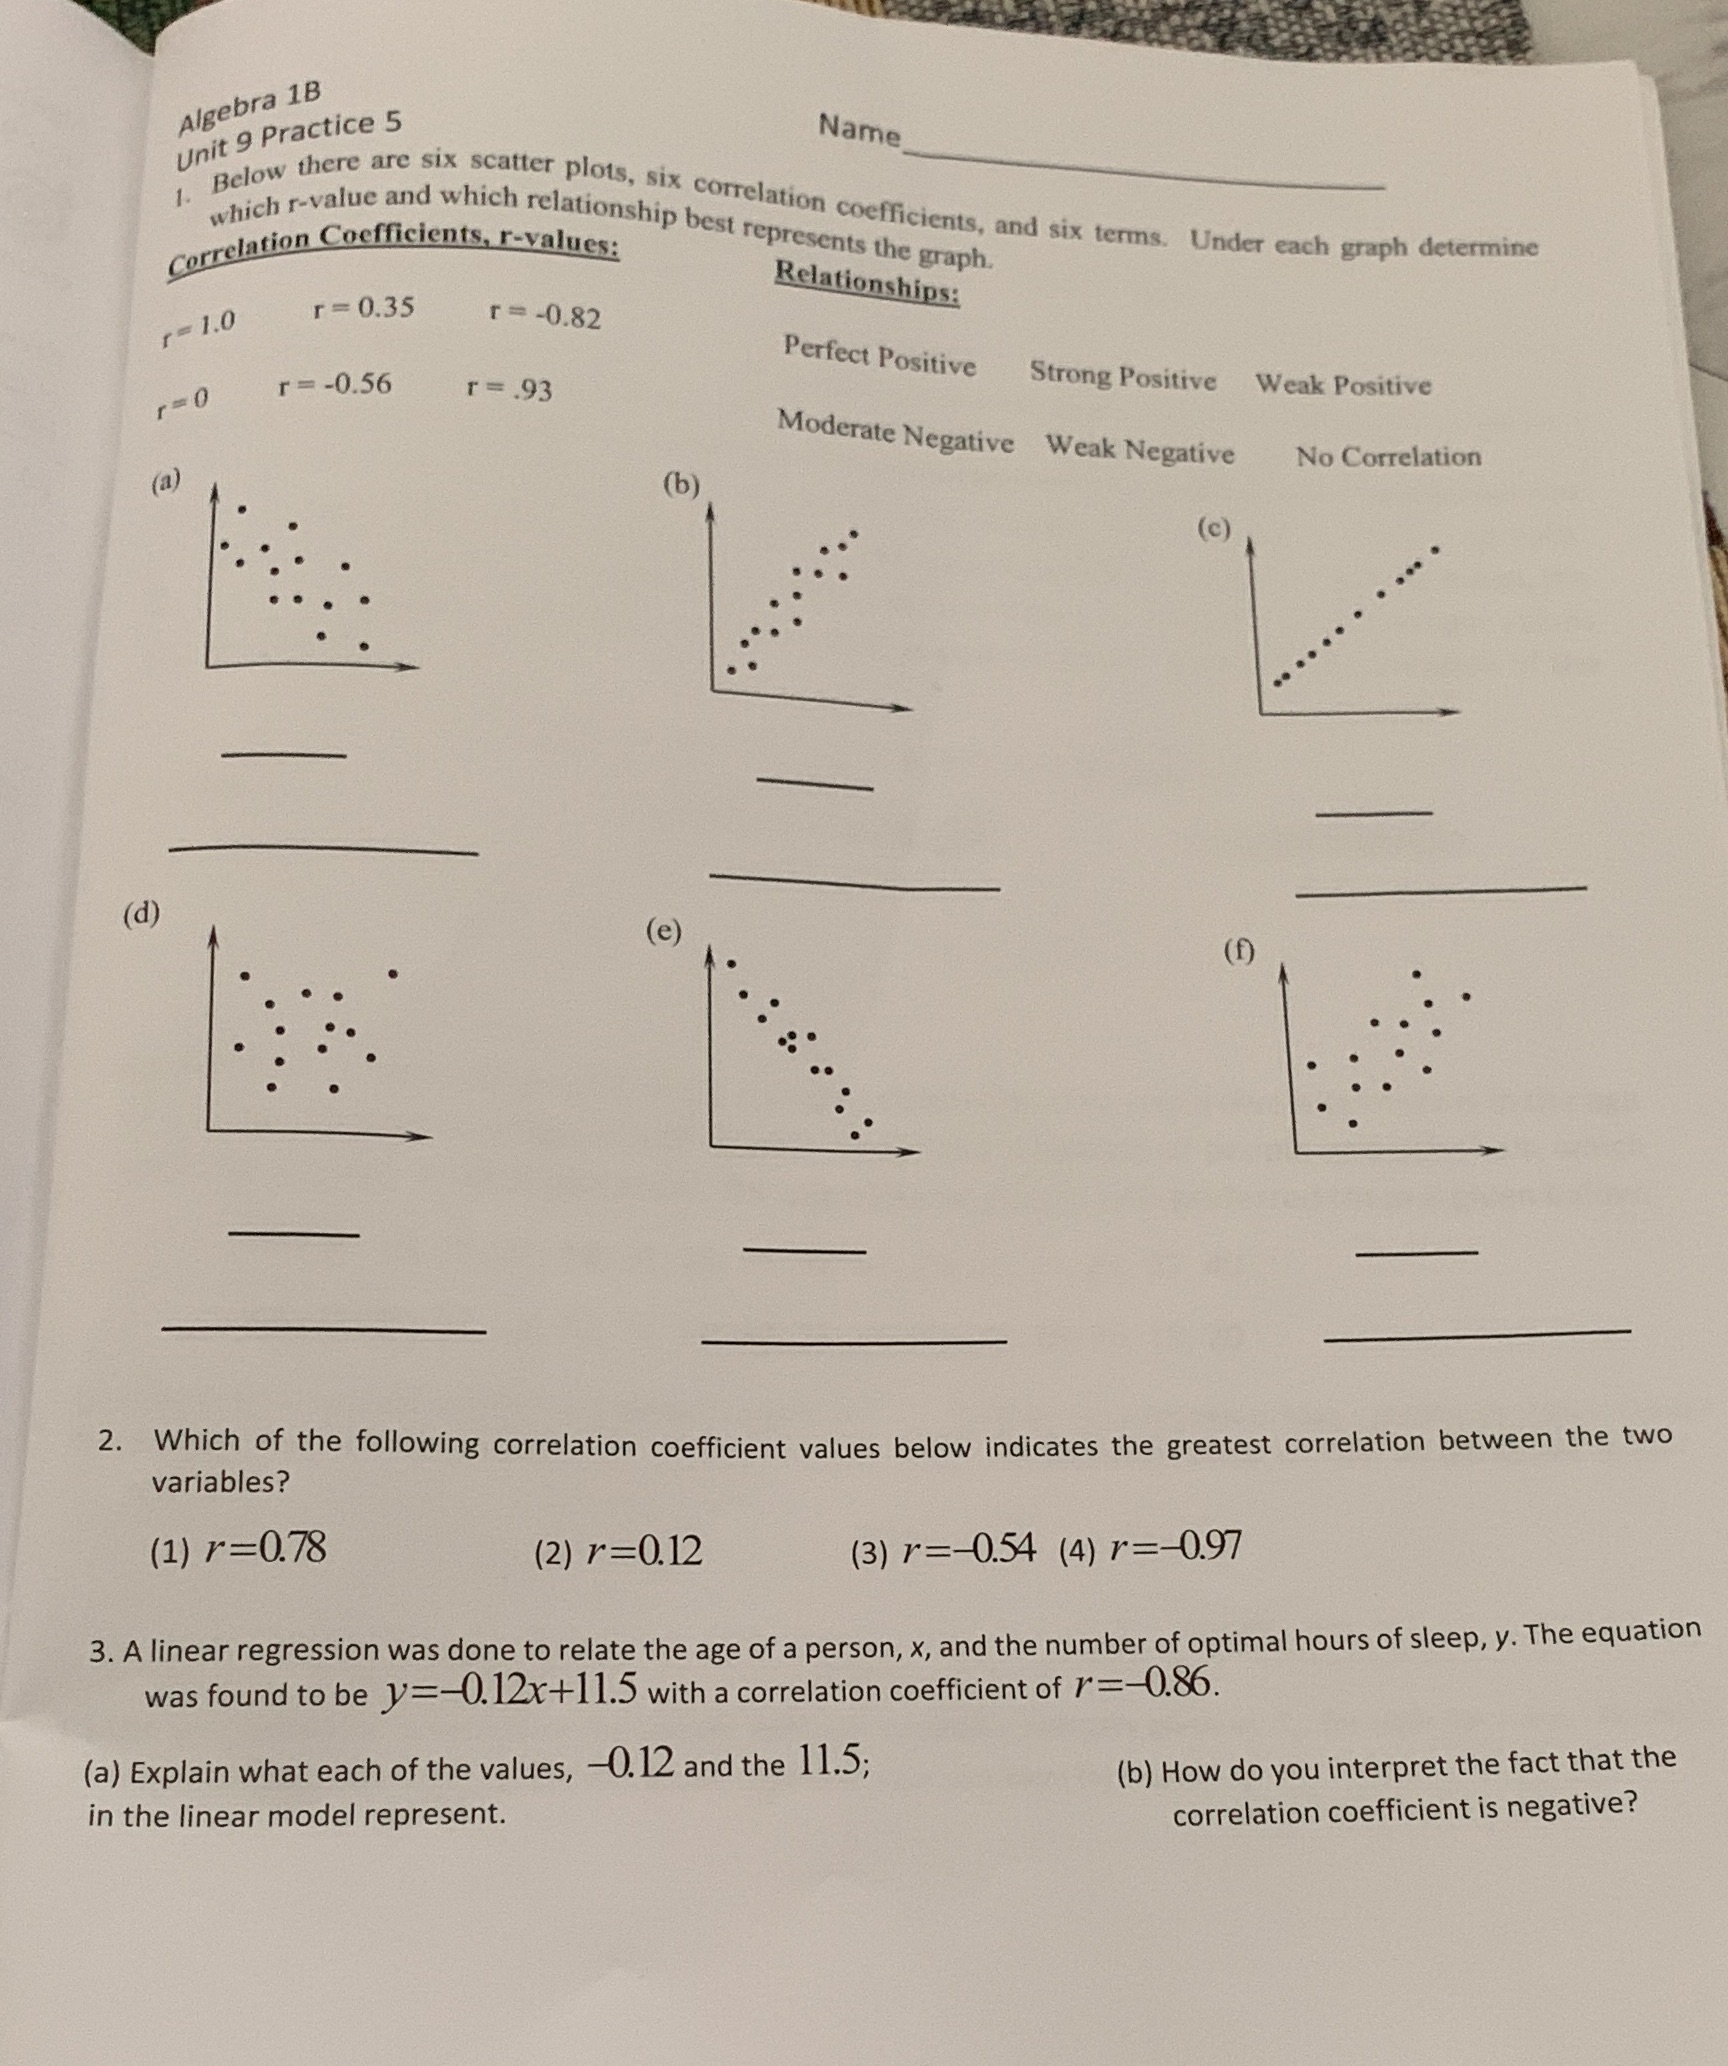
Algebra 1B Unit 9 Practice 5 Name 1. it Now there are six scatter plots, six correlation coefficients, and six terms. Under each graph determine which r-value and which relationship best represents the graph. Correlation Coefficients, r-values: r= 0.35 Relationships: r= 1.0 r =-0.82 Perfect Positive r=0 r=-0.56 1 =.93 Strong Positive Weak Positive Moderate Negative Weak Negative (a) (b) No Correlation (c) . ... .. . . . . . (d) (e) (1) 2. Which of the following correlation coefficient values below indicates the greatest correlation between the two variables? (1) r=0.78 (2) r=0.12 (3) r=-0.54 (4) r=-0.97 3. A linear regression was done to relate the age of a person, x, and the number of optimal hours of sleep, y. The equation was found to be y= 0.12x+11.5 with a correlation coefficient of r= 0.86. (a) Explain what each of the values, -0.12 and the 11.5; (b) How do you interpret the fact that the in the linear model represent. correlation coefficient is negative
Step by Step Solution
There are 3 Steps involved in it

Get step-by-step solutions from verified subject matter experts