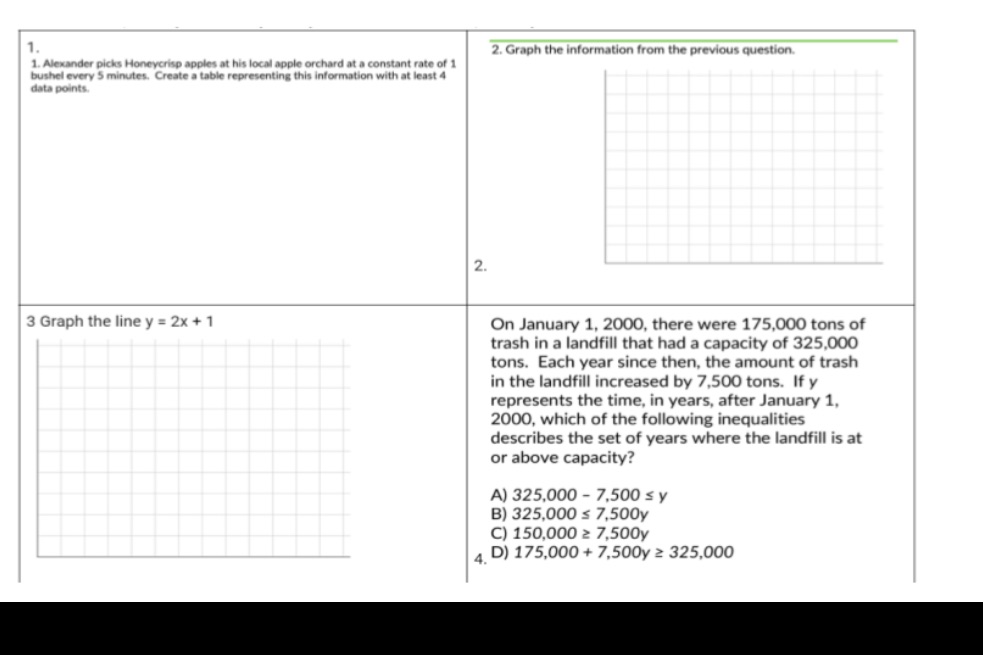
Question: Algebra 2. Graph the information from the previous question. 1. Alexander picks Honeycrisp apples at his local apple orchard at a constant rate of 1

Algebra

Algebra 2. Graph the information from the
2. Graph the information from the previous question. 1. Alexander picks Honeycrisp apples at his local apple orchard at a constant rate of 1 bushel every 5 minutes. Create a table representing this information with at least 4 data points. 2. 3 Graph the line y = 2x + 1 On January 1, 2000, there were 175,000 tons of trash in a landfill that had a capacity of 325,000 tons. Each year since then, the amount of trash in the landfill increased by 7,500 tons. If y represents the time, in years, after January 1, 2000, which of the following inequalities describes the set of years where the landfill is at or above capacity? A) 325,000 - 7,500 s y B) 325,000 s 7,500y C) 150,000 2 7,500y D) 175,000 + 7,500y 2 325,000

Step by Step Solution

There are 3 Steps involved in it

1 Expert Approved Answer
Step: 1 Unlock blur-text-image
Question Has Been Solved by an Expert!

Get step-by-step solutions from verified subject matter experts

Step: 2 Unlock
Step: 3 Unlock

Students Have Also Explored These Related Mathematics Questions!