

Question: Algebra IB Math Happening Module 2 Name: Student ID #: The Basketball Players Problem Prewrite: Key Words and Phrases about Analyzing Data: Histogram Box and
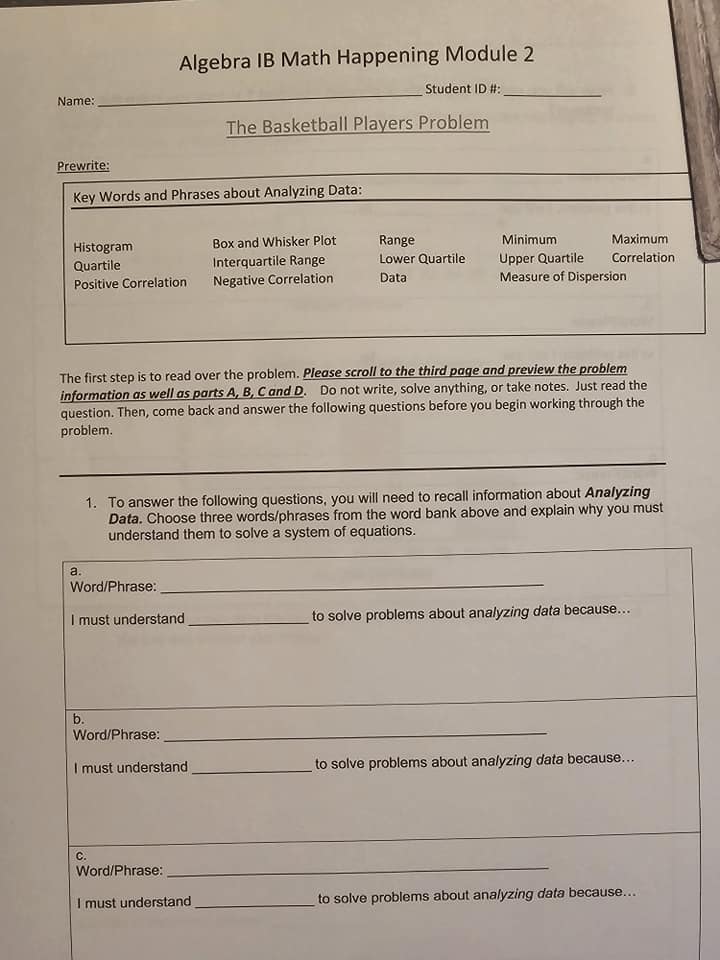
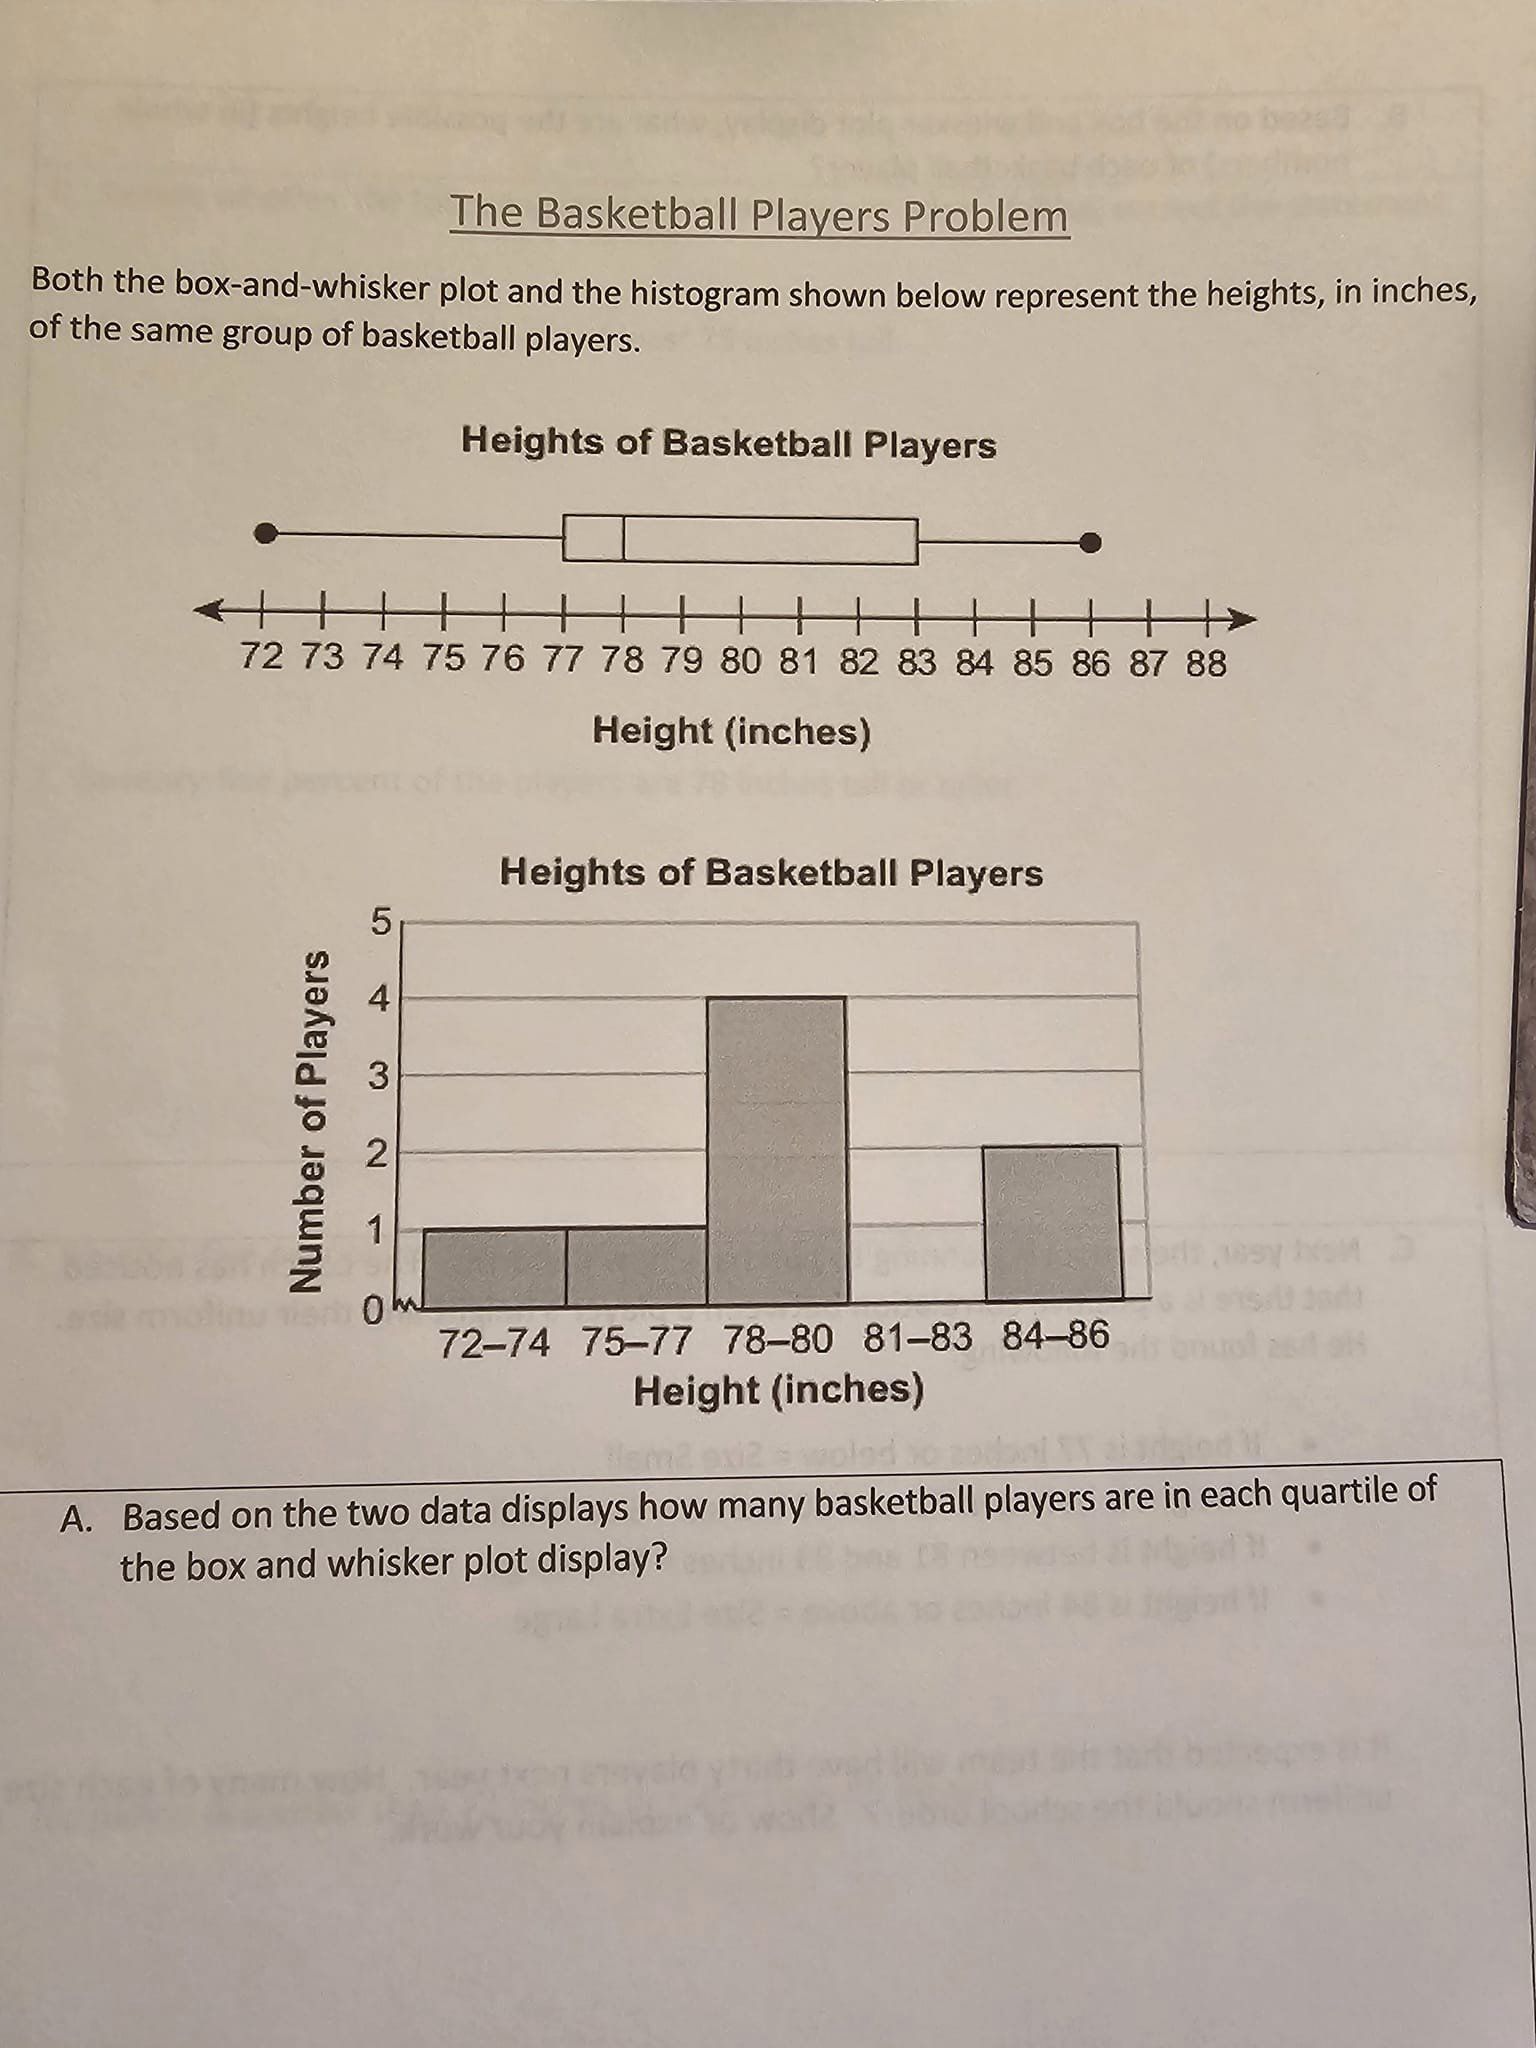
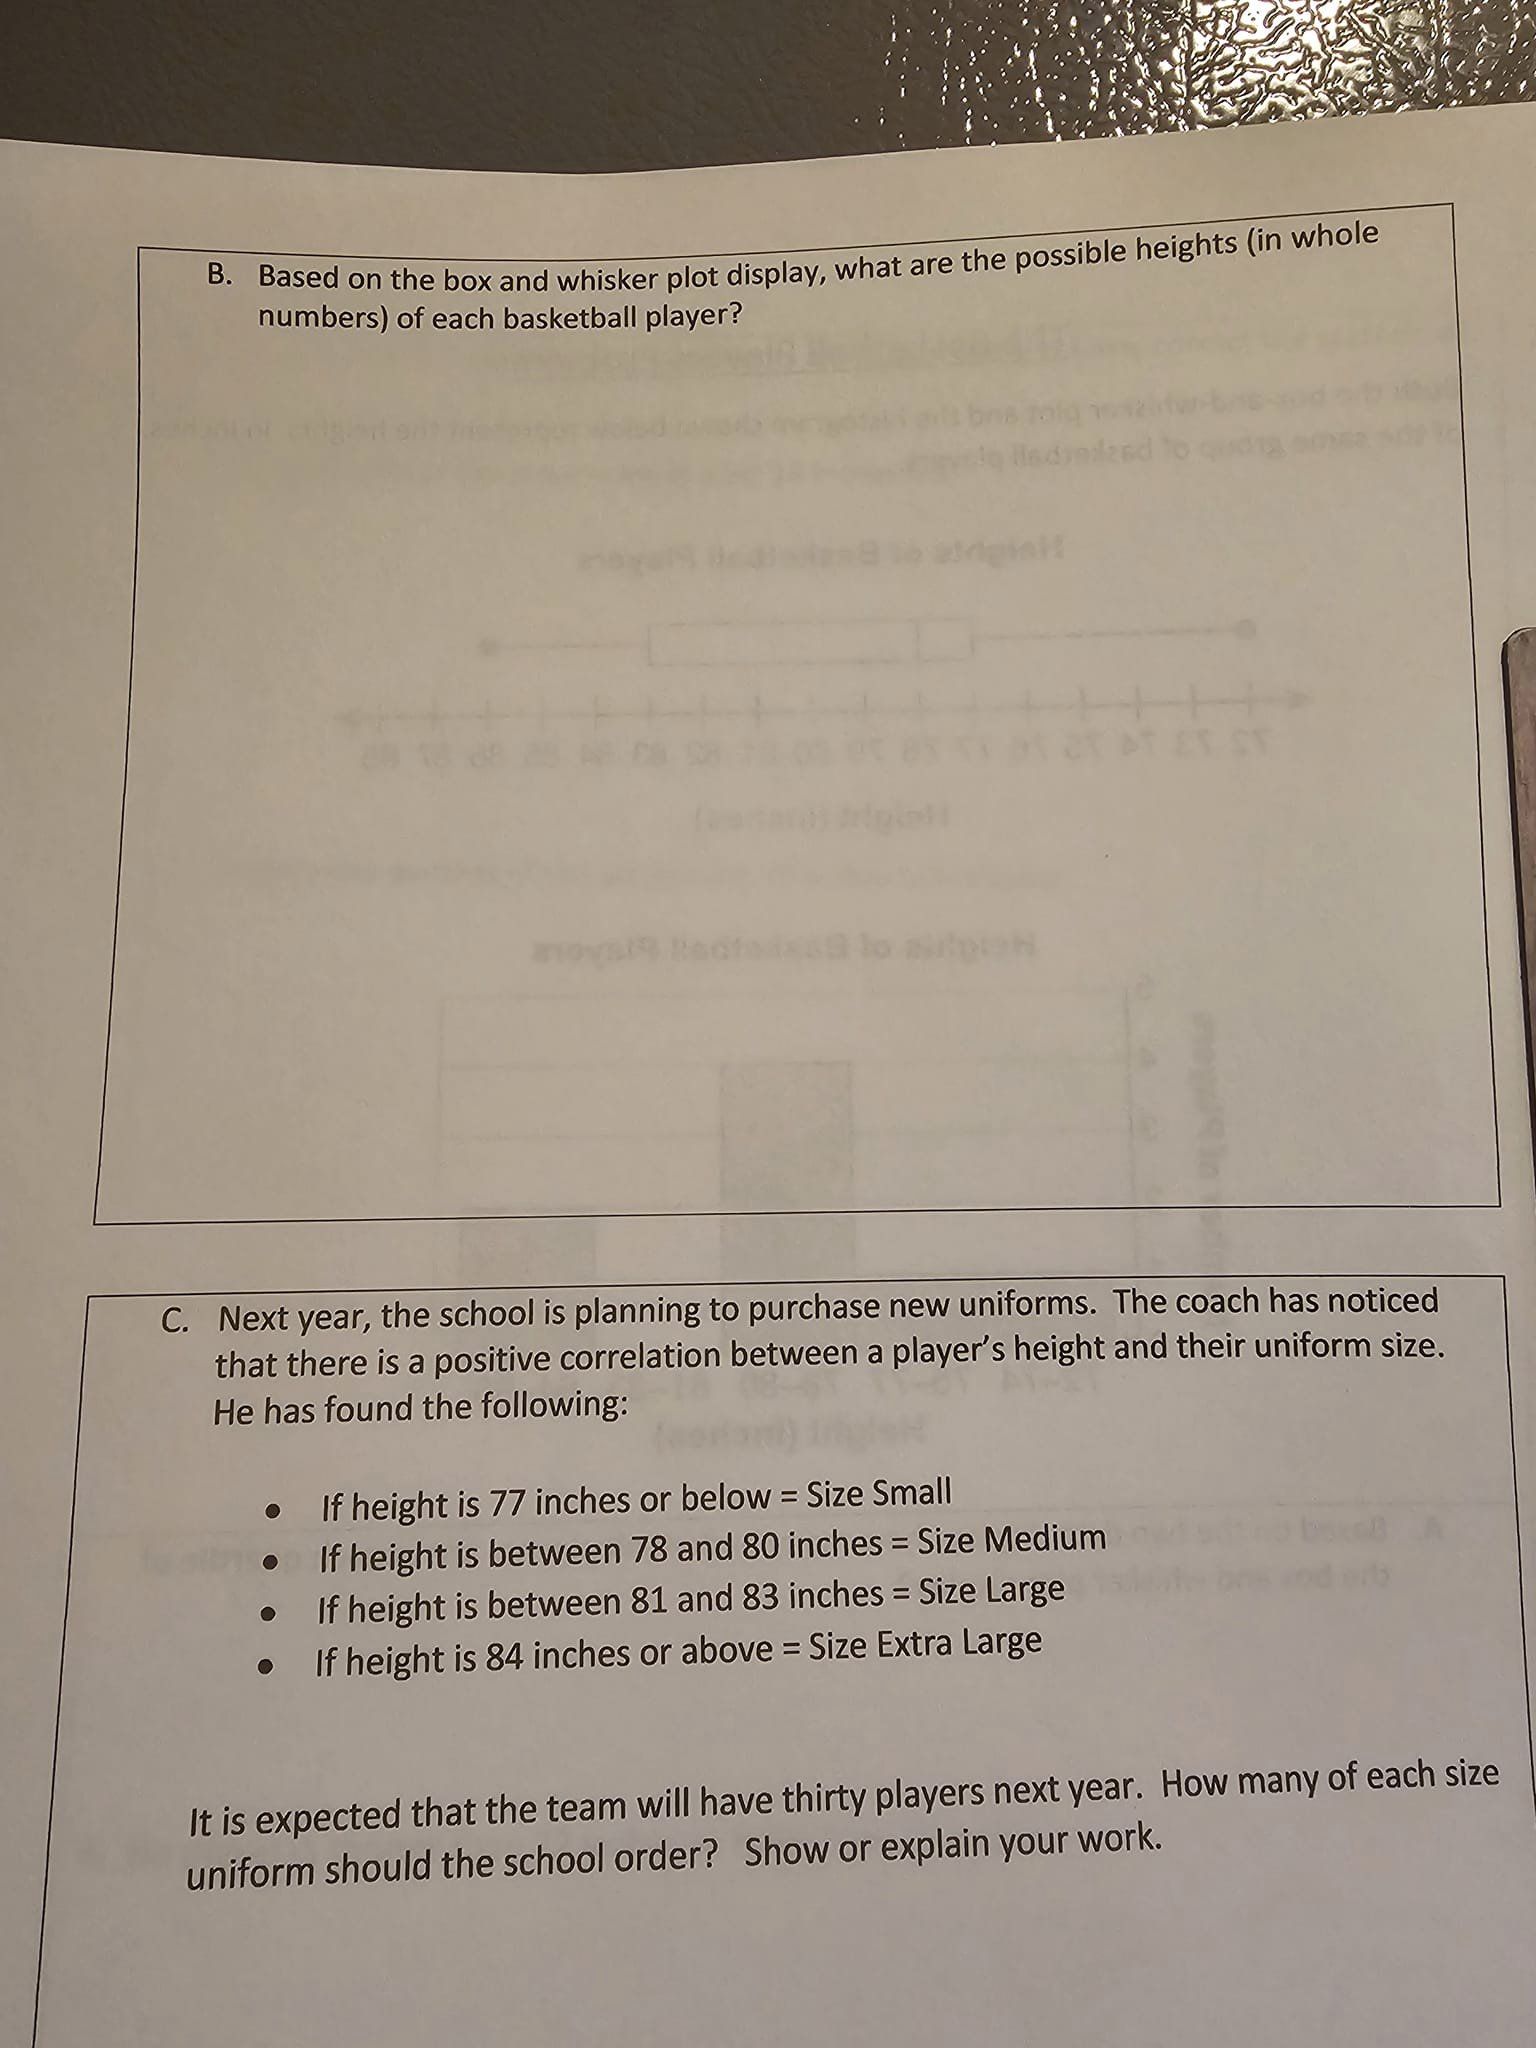
 Algebra IB Math Happening Module 2 Name: Student ID #: The Basketball Players Problem Prewrite: Key Words and Phrases about Analyzing Data: Histogram Box and Whisker Plot Range Minimum Maximum Quartile Interquartile Range Lower Quartile Upper Quartile Correlation Positive Correlation Negative Correlation Data Measure of Dispersion The first step is to read over the problem. Please scroll to the third page and preview the problem information as well as parts A, B, C and D. Do not write, solve anything, or take notes. Just read the question. Then, come back and answer the following questions before you begin working through the problem. 1. To answer the following questions, you will need to recall information about Analyzing Data. Choose three words/phrases from the word bank above and explain why you must understand them to solve a system of equations. a. Word/Phrase: I must understand to solve problems about analyzing data because... b. Word/Phrase: I must understand to solve problems about analyzing data because... C. Word/Phrase: I must understand to solve problems about analyzing data because...2. How will you use the keywords or phrases from part 1 to help you solve this problem? a. Word/Phrase: In this problem, I will use by ... b. Word/Phrase: In this problem, I will use by ... C. Word/Phrase: In this problem, I will use by...The Basketball Players Problem Both the box-and-whisker plot and the histogram shown below represent the heights, in inches, of the same group of basketball players. Heights of Basketball Players 72 73 74 75 76 77 78 79 80 81 82 83 84 85 86 87 88 Height (inches) Heights of Basketball Players 5 Number of Players N Om 72-74 75-77 78-80 81-83 84-86 Height (inches) A. Based on the two data displays how many basketball players are in each quartile of the box and whisker plot display?B. Based on the box and whisker plot display, what are the possible heights (in whole numbers) of each basketball player? C. Next year, the school is planning to purchase new uniforms. The coach has noticed that there is a positive correlation between a player's height and their uniform size. He has found the following: If height is 77 inches or below = Size Small If height is between 78 and 80 inches = Size Medium . If height is between 81 and 83 inches = Size Large . If height is 84 inches or above = Size Extra Large It is expected that the team will have thirty players next year. How many of each size uniform should the school order? Show or explain your work.D. Decide whether the following statements are true or false. If false, correct the statement. 1. At most, 25% of the players are at least 78 inches tall. 2. Seventy-five percent of the players are 78 inches tall or taller. 3. Seventy-five percent of the players are shorter than 81 inches. 4. No player is shorter than 72 inches or taller than 85 inches.Reflection: Pick only one of the three questions below to answer. 1. What do you believe is one of the most common mistakes students make when analyzing data on a histogram or box and whisker plot? Why do you believe they make that mistake? What suggestions would you offer to avoid the mistake in the future? (Answer should be at least 3 - 5 complete sentences.) -OR- 2. What do you believe is a common misunderstanding students have about analyzing data? Why do you believe they have that misunderstanding? What suggestions would you offer to correct the misunderstanding? (Answer should be at least 3 - 5 complete sentences.) -OR- 3. In real life, where or when do you think you would use analyzing data to solve a problem? Describe the situation using 3 -5 sentences
Step by Step Solution
There are 3 Steps involved in it

Get step-by-step solutions from verified subject matter experts