

Question: Alinear regression was performed on some data. Based on the diagnostic plots below, pick the best option The data displays non-cot variance The model appears
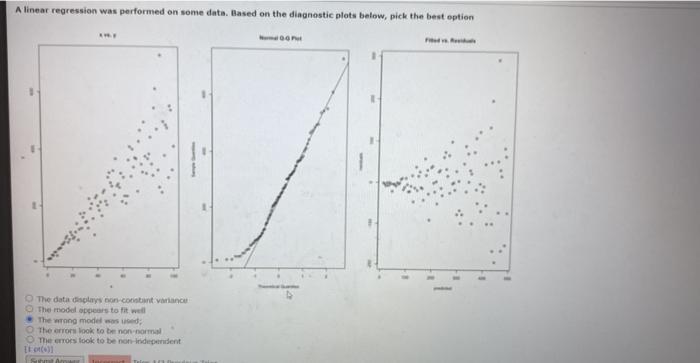
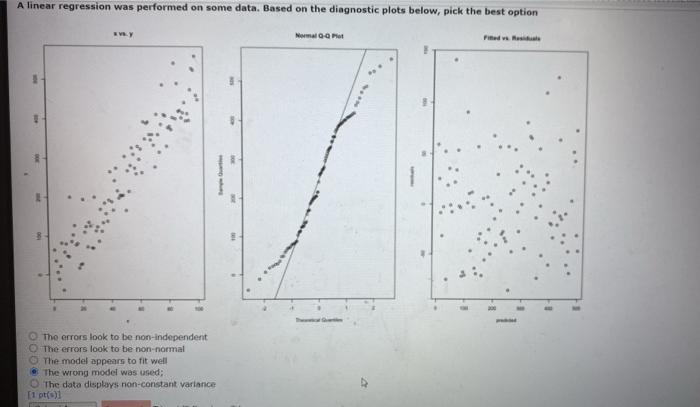
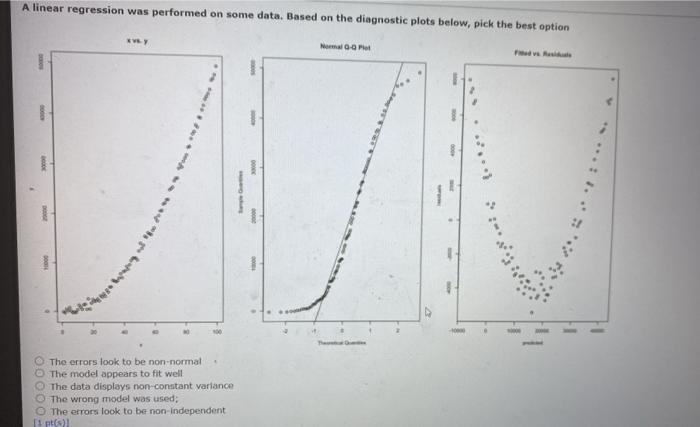
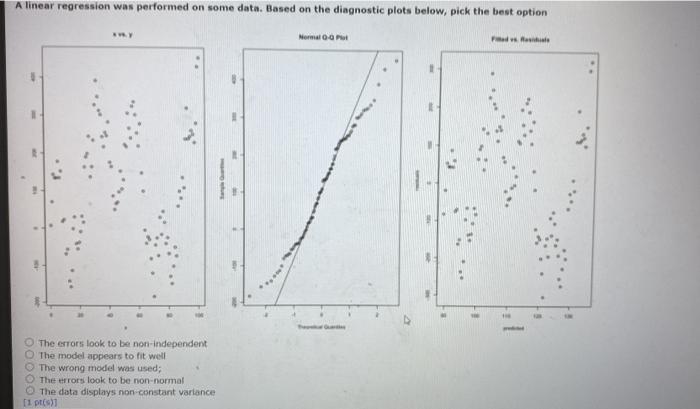
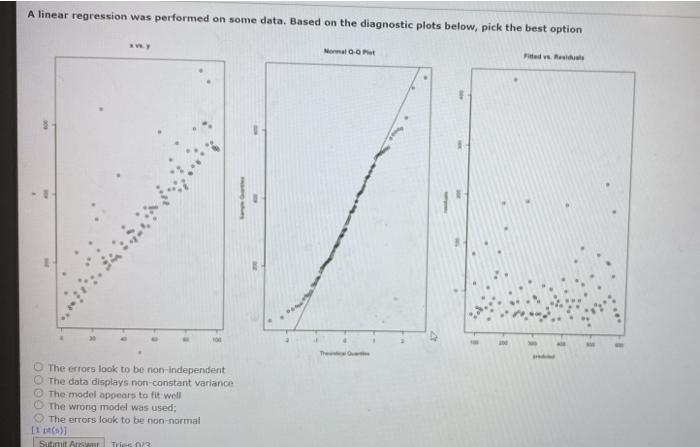
Alinear regression was performed on some data. Based on the diagnostic plots below, pick the best option The data displays non-cot variance The model appears to fit well The wrong model was used The error look to be non-normal The errors look to be non-independent A linear regression was performed on some data. Based on the diagnostic plots below, pick the best option The errors look to be non-independent The errors look to be non-normal The model appears to fit well The wrong model was used; The data displays non-constant variance [1 pts) A linear regression was performed on some data. Based on the diagnostic plots below, pick the best option Normal 1 1 1 The errors look to be on normal The model appears to fit well The data displays non-constant variance The wrong model was used; The errors look to be non independent 11 pt A linear regression was performed on some data. Based on the diagnostic plots below, pick the best option * Normal The errors look to be non-Independent The model appears to fit well The wrong model was used; The error look to be non-normal The data displays non constant variance (1 p.) A linear regression was performed on some data. Based on the diagnostic plots below, pick the best option Normalt dvs. Res 1 The The errors look to be non-independent The data displays non-constant variance The model appears to fit well The wrong model was used; The errors look to be non-normal [106 Submit An Tr 0/3 Alinear regression was performed on some data. Based on the diagnostic plots below, pick the best option The data displays non-cot variance The model appears to fit well The wrong model was used The error look to be non-normal The errors look to be non-independent A linear regression was performed on some data. Based on the diagnostic plots below, pick the best option The errors look to be non-independent The errors look to be non-normal The model appears to fit well The wrong model was used; The data displays non-constant variance [1 pts) A linear regression was performed on some data. Based on the diagnostic plots below, pick the best option Normal 1 1 1 The errors look to be on normal The model appears to fit well The data displays non-constant variance The wrong model was used; The errors look to be non independent 11 pt A linear regression was performed on some data. Based on the diagnostic plots below, pick the best option * Normal The errors look to be non-Independent The model appears to fit well The wrong model was used; The error look to be non-normal The data displays non constant variance (1 p.) A linear regression was performed on some data. Based on the diagnostic plots below, pick the best option Normalt dvs. Res 1 The The errors look to be non-independent The data displays non-constant variance The model appears to fit well The wrong model was used; The errors look to be non-normal [106 Submit An Tr 0/3
Step by Step Solution
There are 3 Steps involved in it

Get step-by-step solutions from verified subject matter experts