

ALKO began in 1943 in a garage workshop set up by John Williams at his Cleveland...
Fantastic news! We've Found the answer you've been seeking!
Question:
Transcribed Image Text:
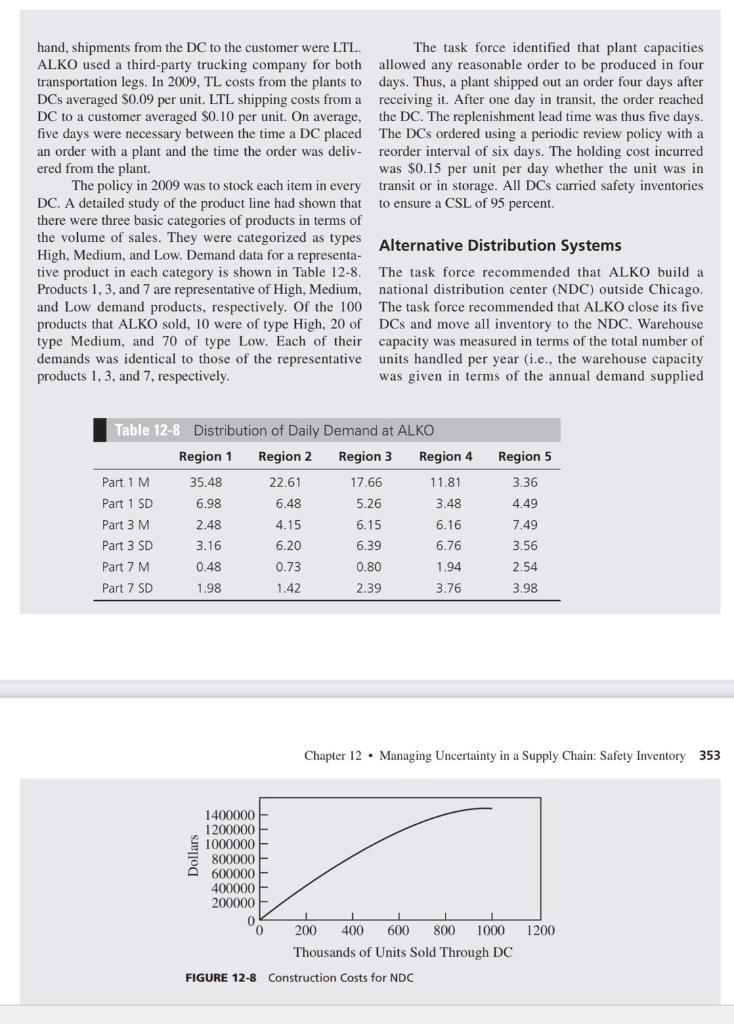
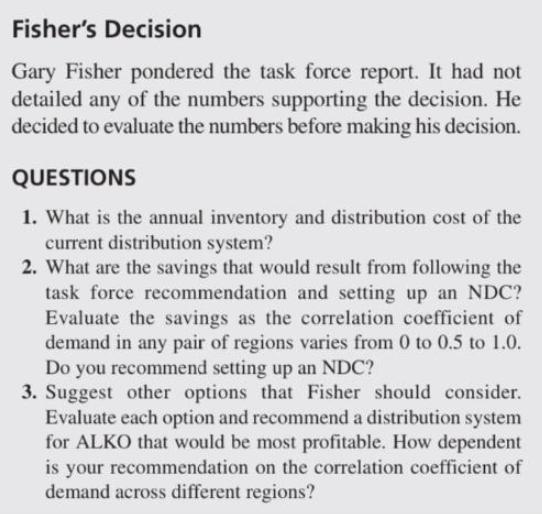
ALKO began in 1943 in a garage workshop set up by John Williams at his Cleveland home. John had always enjoyed tinkering, and in February 1948 he obtained a patent for one of his designs for lighting fixtures. He decided to produce it in his workshop and tried marketing it in the Cleveland area. The product sold well, and by 1957 ALKO had grown to a $3 million company. Its lighting fixtures were well known for their outstanding quality. By then, it sold a total of five products. In 1963, John took the company public. Since then, ALKO has been very successful, and the company has started distributing its products nationwide. As com- petition intensified in the 1980s, ALKO introduced many new lighting fixture designs. The company's profitability, however, began to worsen despite the fact that ALKO had taken great care to ensure that product quality did not suffer. The problem was that margins had begun to shrink as competition in the market intensified. At this point, the board decided that a complete reorgan- ization was needed, starting at the top. Gary Fisher was hired to reorganize and restructure the company. When Fisher arrived in 2009, he found a company teetering on the edge. He spent his first few months trying to understand the company business and the way it was structured. Fisher realized that the key was in the operating performance. Although the company had always been outstanding at developing and producing new products, it had historically ignored its dis- tribution system. The belief within the company was that once you make a good product, the rest takes care of itself. Fisher set up a task force to review the company's current distribution system and come up with recommendations. The Current Distribution System The task force noted that ALKO had 100 products in its 2009 line. All production occurred at three facilities located in the Cleveland area. For sales purposes, the contiguous United States was divided into five regions,. as shown in Figure 12-7. A DC owned by ALKO operated in each of these regions. Customers placed orders with the DCs, which tried to supply them from product in inventory. As the inventory for any product diminished, the DC in turn ordered from the plants. The plants scheduled production based on DC orders. Orders were transported from plants to the DCs in TL quantities because order sizes tended to be large. On the other The task force identified that plant capacities hand, shipments from the DC to the customer were LTL ALKO used a third-party trucking company for both allowed any reasonable order to be produced in four transportation legs. In 2009, TL costs from the plants to days. Thus, a plant shipped out an order four days after DCs averaged S0.09 per unit. LTL shipping costs from a DC to a customer averaged $0.10 per unit. On average, the DC. The replenishment lead time was thus five days. five days were necessary between the time a DC placed The DCs ordered using a periodic review policy with a an order with a plant and the time the order was deliv- reorder interval of six days. The holding cost incurred ered from the plant. The policy in 2009 was to stock each item in every transit or in storage. All DCs carried safety inventories DC. A detailed study of the product line had shown that there were three basic categories of products in terms of the volume of sales. They were categorized as types Alternative Distribution Systems High, Medium, and Low. Demand data for a representa- tive product in each category is shown in Table 12-8. Products 1, 3, and 7 are representative of High, Medium, national distribution center (NDC) outside Chicago. and Low demand products, respectively. Of the 100 The task force recommended that ALKO close its five products that ALKO sold, 10 were of type High, 20 of type Medium, and 70 of type Low. Each of their receiving it. After one day in transit, the order reached was $0.15 per unit per day whether the unit was in to ensure a CSL of 95 percent. The task force recommended that ALKO build a DCs and move all inventory to the NDC. Warehouse capacity was measured in terms of the total number of demands was identical to those of the representative units handled per year (i.e., the warehouse capacity products 1, 3, and 7, respectively. was given in terms of the annual demand supplied Table 12-8 Distribution of Daily Demand at ALKO Region 1 Region 2 Region 3 Region 4 Region 5 Part 1 M 35.48 22.61 17.66 11.81 3.36 Part 1 SD 6.98 6.48 5.26 3.48 4.49 Part 3 M 2.48 4.15 6.15 6.16 7.49 Part 3 SD 3.16 6.20 6.39 6.76 3.56 Part 7 M 0.48 0.73 0.80 1.94 2.54 Part 7 SD 1.98 1.42 2.39 3.76 3,98 Chapter 12 · Managing Uncertainty in a Supply Chain: Safety Inventory 353 1400000 1200000 1000000 800000 Á 600000 400000 200000 200 400 600 800 1000 1200 Thousands of Units Sold Through DC FIGURE 12-8 Construction Costs for NDC Dollars from the warehouse). The cost of constructing a warehouse is shown in Figure 12-8. However, ALKO expected to recover $50,000 for each warehouse that it closed. The CSL out of the NDC would continue to be 95 percent. Given that Chicago is close to Cleveland, the inbound transportation cost from the plants to the NDC would fall to $0.05 per unit. The total replenishment lead time for the Chicago NDC would still be five days (four days for production + one day in transit). Given the increased average distance, however, the outbound transportation cost to customers from the NDC would increase to $0.24 per unit. Other possibilities the task force considered include building a national distribution center while keeping the regional DCs open. In this case, some products would be stocked at the regional DCs, whereas others would be stocked at the NDC. Fisher's Decision Gary Fisher pondered the task force report. It had not detailed any of the numbers supporting the decision. He decided to evaluate the numbers before making his decision. QUESTIONS 1. What is the annual inventory and distribution cost of the current distribution system? 2. What are the savings that would result from following the task force recommendation and setting up an NDC? Evaluate the savings as the correlation coefficient of demand in any pair of regions varies from 0 to 0.5 to 1.0. Do you recommend setting up an NDC? 3. Suggest other options that Fisher should consider. Evaluate each option and recommend a distribution system for ALKO that would be most profitable. How dependent is your recommendation on the correlation coefficient of demand across different regions? ALKO began in 1943 in a garage workshop set up by John Williams at his Cleveland home. John had always enjoyed tinkering, and in February 1948 he obtained a patent for one of his designs for lighting fixtures. He decided to produce it in his workshop and tried marketing it in the Cleveland area. The product sold well, and by 1957 ALKO had grown to a $3 million company. Its lighting fixtures were well known for their outstanding quality. By then, it sold a total of five products. In 1963, John took the company public. Since then, ALKO has been very successful, and the company has started distributing its products nationwide. As com- petition intensified in the 1980s, ALKO introduced many new lighting fixture designs. The company's profitability, however, began to worsen despite the fact that ALKO had taken great care to ensure that product quality did not suffer. The problem was that margins had begun to shrink as competition in the market intensified. At this point, the board decided that a complete reorgan- ization was needed, starting at the top. Gary Fisher was hired to reorganize and restructure the company. When Fisher arrived in 2009, he found a company teetering on the edge. He spent his first few months trying to understand the company business and the way it was structured. Fisher realized that the key was in the operating performance. Although the company had always been outstanding at developing and producing new products, it had historically ignored its dis- tribution system. The belief within the company was that once you make a good product, the rest takes care of itself. Fisher set up a task force to review the company's current distribution system and come up with recommendations. The Current Distribution System The task force noted that ALKO had 100 products in its 2009 line. All production occurred at three facilities located in the Cleveland area. For sales purposes, the contiguous United States was divided into five regions,. as shown in Figure 12-7. A DC owned by ALKO operated in each of these regions. Customers placed orders with the DCs, which tried to supply them from product in inventory. As the inventory for any product diminished, the DC in turn ordered from the plants. The plants scheduled production based on DC orders. Orders were transported from plants to the DCs in TL quantities because order sizes tended to be large. On the other The task force identified that plant capacities hand, shipments from the DC to the customer were LTL ALKO used a third-party trucking company for both allowed any reasonable order to be produced in four transportation legs. In 2009, TL costs from the plants to days. Thus, a plant shipped out an order four days after DCs averaged S0.09 per unit. LTL shipping costs from a DC to a customer averaged $0.10 per unit. On average, the DC. The replenishment lead time was thus five days. five days were necessary between the time a DC placed The DCs ordered using a periodic review policy with a an order with a plant and the time the order was deliv- reorder interval of six days. The holding cost incurred ered from the plant. The policy in 2009 was to stock each item in every transit or in storage. All DCs carried safety inventories DC. A detailed study of the product line had shown that there were three basic categories of products in terms of the volume of sales. They were categorized as types Alternative Distribution Systems High, Medium, and Low. Demand data for a representa- tive product in each category is shown in Table 12-8. Products 1, 3, and 7 are representative of High, Medium, national distribution center (NDC) outside Chicago. and Low demand products, respectively. Of the 100 The task force recommended that ALKO close its five products that ALKO sold, 10 were of type High, 20 of type Medium, and 70 of type Low. Each of their receiving it. After one day in transit, the order reached was $0.15 per unit per day whether the unit was in to ensure a CSL of 95 percent. The task force recommended that ALKO build a DCs and move all inventory to the NDC. Warehouse capacity was measured in terms of the total number of demands was identical to those of the representative units handled per year (i.e., the warehouse capacity products 1, 3, and 7, respectively. was given in terms of the annual demand supplied Table 12-8 Distribution of Daily Demand at ALKO Region 1 Region 2 Region 3 Region 4 Region 5 Part 1 M 35.48 22.61 17.66 11.81 3.36 Part 1 SD 6.98 6.48 5.26 3.48 4.49 Part 3 M 2.48 4.15 6.15 6.16 7.49 Part 3 SD 3.16 6.20 6.39 6.76 3.56 Part 7 M 0.48 0.73 0.80 1.94 2.54 Part 7 SD 1.98 1.42 2.39 3.76 3,98 Chapter 12 · Managing Uncertainty in a Supply Chain: Safety Inventory 353 1400000 1200000 1000000 800000 Á 600000 400000 200000 200 400 600 800 1000 1200 Thousands of Units Sold Through DC FIGURE 12-8 Construction Costs for NDC Dollars from the warehouse). The cost of constructing a warehouse is shown in Figure 12-8. However, ALKO expected to recover $50,000 for each warehouse that it closed. The CSL out of the NDC would continue to be 95 percent. Given that Chicago is close to Cleveland, the inbound transportation cost from the plants to the NDC would fall to $0.05 per unit. The total replenishment lead time for the Chicago NDC would still be five days (four days for production + one day in transit). Given the increased average distance, however, the outbound transportation cost to customers from the NDC would increase to $0.24 per unit. Other possibilities the task force considered include building a national distribution center while keeping the regional DCs open. In this case, some products would be stocked at the regional DCs, whereas others would be stocked at the NDC. Fisher's Decision Gary Fisher pondered the task force report. It had not detailed any of the numbers supporting the decision. He decided to evaluate the numbers before making his decision. QUESTIONS 1. What is the annual inventory and distribution cost of the current distribution system? 2. What are the savings that would result from following the task force recommendation and setting up an NDC? Evaluate the savings as the correlation coefficient of demand in any pair of regions varies from 0 to 0.5 to 1.0. Do you recommend setting up an NDC? 3. Suggest other options that Fisher should consider. Evaluate each option and recommend a distribution system for ALKO that would be most profitable. How dependent is your recommendation on the correlation coefficient of demand across different regions?
Expert Answer:

Related Book For 

Income Tax Fundamentals 2013
ISBN: 9781285586618
31st edition
Authors: Gerald E. Whittenburg , Martha Altus Buller, Steven L Gill
Posted Date:
Students also viewed these accounting questions
-
Case Study - Sleep Apnea After interviewing Senior Reynold, you note the following: Mr. Reynold is under considerable stress. He owns his own business. The stress of overseeing his employees, meeting...
-
John Williams (age 42) is a single taxpayer, and he lives at 1324 Forest Dr., Reno, NV 89501. His Social Security number is 555-94-9358. John's earnings and withholdings as the manager of a local...
-
PSR (Pty) Ltd is registered as a category A vat vendor in terms of S27 of the VAT Act. The company publishes tax textbooks for the local and export market. The following information has been provided...
-
Recent trends in recruiting rely on social capital by ______. Multiple choice question. making use of structural holes between groups in a social network where there are few relationships bridging...
-
Explain how "elastic potential energy" dramatically changed the sport of pole vaulting when flexible fiberglass poles replaced stiffer wooden poles.
-
In the triplet-binding assay carried out by Nirenberg and Leder, an RNA triplet composed of three bases was able to cause the a. translation of a polypeptide. b. binding of a tRNA carrying the...
-
Panther Racing, LLC, is involved in competitive racing, including the development, maintenance, and operation of a racing team in the IndyCar series. Beginning in 2008, the National Guard annually...
-
Jims Outfitters, Inc., makes custom fancy shirts for cowboys. The shirts could be flawed in various ways, including flaws in the weave or color of the fabric, loose buttons or decorations, wrong...
-
DataBase managment design. Do the dowsings: 1. Run the sql commands written in ddl.sql file attached 2. Create_a dummy data. You can use "fake data generators" 3. Write followings - Write the query...
-
Non-controlling interests of profitable subsidiaries result in a credit item in the income statement and a debit balance in the statement of financial position. True/False
-
Which line of code is a part of an EJS template? let sqlquery = " = " SELECT * * FROM books"; res.send ( ( result ) ) ; res.render ( ' " id="MathJax-Element-5-Frame" role="presentation"...
-
Objective: Develop a proposal in which you present your business idea to me and explain its feasibility for the Prospectus project-- be sure you've read the description for Assignment 3: The...
-
What are the implications of hybridization and introgression in speciation processes, particularly in complex evolutionary scenarios?
-
What are the ecological factors influencing adaptive radiation, and how does this phenomenon lead to the emergence of multiple species from a common ancestor?
-
Owner C has a business with a linear, downward-sloping demand curve. He is currently charging the highest possible price for his product, which has an elastic demand. Will he earn more revenue if he...
-
Technological progress has been steadily made in the history of mankind, and agricultural technology progress was no exception. While some economists view technological progress as an exogenous shock...
-
For revision purpose Corporate and Division Strategic Planning, thoroughly explain the following: . Defining the corporate mission . Establishing strategic business units . Assigning resources to...
-
Cable Corporation is 60% owned by Anna and 40% owned by Jim, who are unrelated. It has noncash assets, which it sells to an unrelated purchaser for $100,000 in cash and $900,000 in installment...
-
Jason and Mary are married taxpayers in 2012. They are both under age 65 and in good health. For this tax year, they have a total of $41,000 in wages and $500 in interest income. Jason and Mary's...
-
Rebecca and Walter Bunge have been married for 5 years. They live at 883 Scrub Brush Street, Apt. 52B, Las Vegas, NV 89125. Rebecca is a homemaker and Walt is a high school teacher. Rebecca's Social...
-
In the 2012 tax year, Michelle paid the following amounts relating to her 2010 tax return: Tax deficiency..........................................$5,000 Negligence...
-
True or false? Economic theory argues that discrimination should be eliminated. Why?
-
Why is discrimination based on characteristics that affect job performance difficult to eliminate?
-
Visit the Suzy Lamplugh Trust website at http://www.suzylamplugh.org and the Social Research Association at http://the-sra.org.uk/sra_resources/safety-code/ . Browse the guidance leaflets/web pages...

Study smarter with the SolutionInn App