

Question: All are one problem, don't come at me for the different problems. Needs to be done within Excel, please and thank you. Construct P charts
All are one problem, don't come at me for the different problems. Needs to be done within Excel, please and thank you.
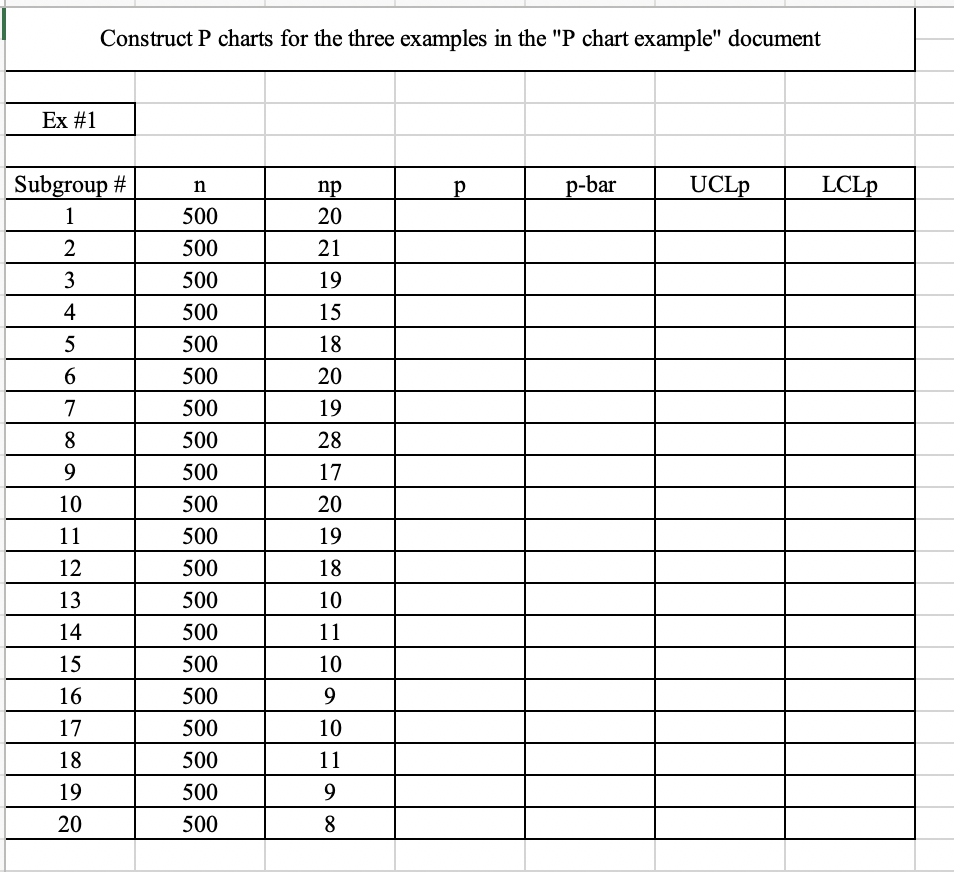
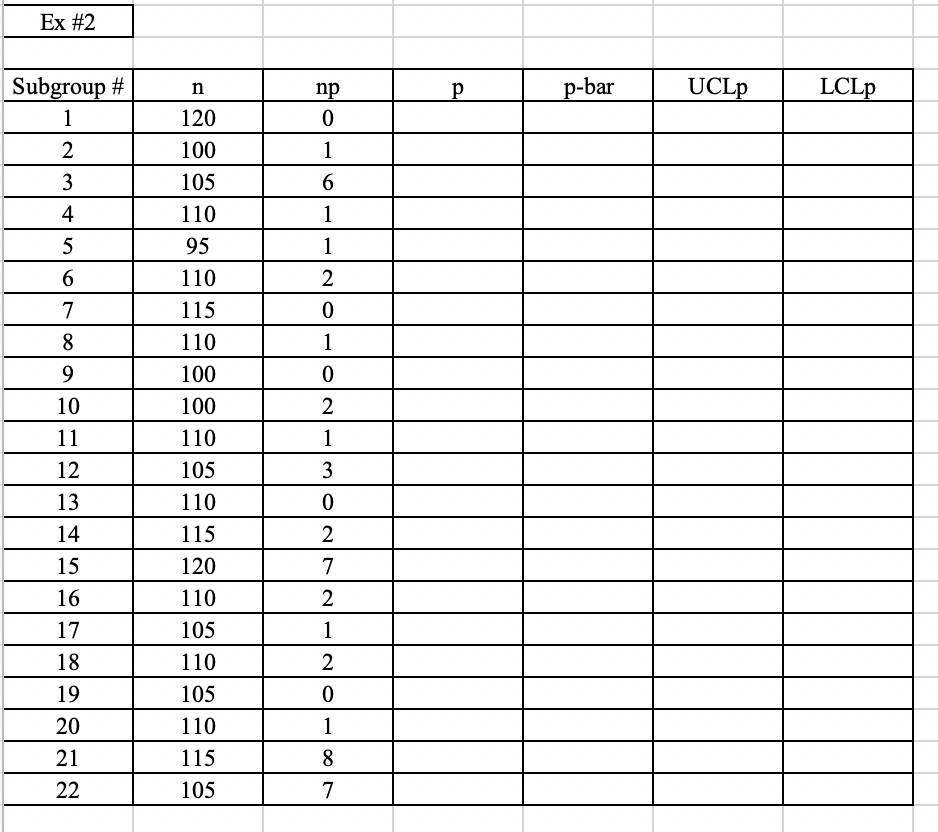
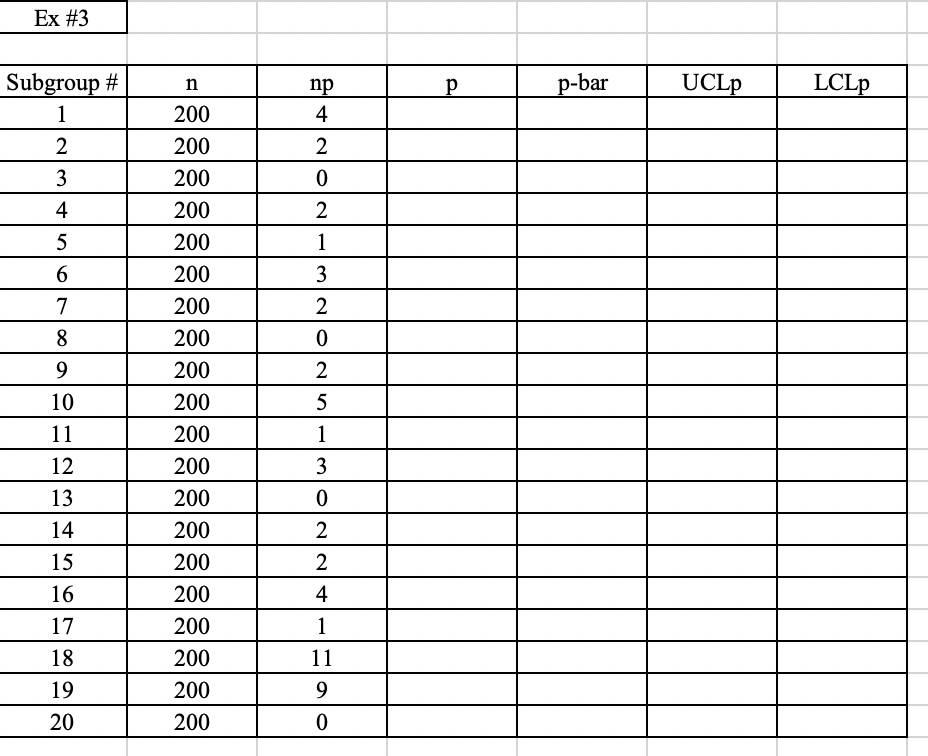
Construct P charts for the three examples in the "P chart example" document Ex #1 n p-bar UCLp LCLp TO np 20 Subgroup # 1 2 3 4 5 6 7 21 19 15 18 8 20 19 28 17 20 9 10 11 12 500 500 500 500 500 500 500 500 500 500 500 500 500 500 500 500 500 500 500 500 19 18 13 10 14 11 10 15 16 9 10 17 18 11 19 9 20 8 Ex #2 n p p-bar UCLp Subgroup # 1 LCLp np 0 120 2 100 1 ml 105 6 4 1 5 110 95 110 6 7 115 110 1 2 0 1 0 2 8 9 100 100 10 11 110 1 105 3 0 2 7 12 13 14 15 16 17 18 19 110 115 120 110 105 110 105 2 1 20 110 115 2 0 1 8 7 21 22 105 Ex #3 n p p-bar UCLp LCLp Subgroup # 1 200 u AWN np 4 2 0 2 1 3 2 6 7 8 0 9 2 10 11 200 200 200 200 200 200 200 200 200 200 200 200 200 200 200 200 200 200 200 5 1 3 0 12 13 14 15 16 2 2 4 17 18 1 11 19 9 20 0Step by Step Solution
There are 3 Steps involved in it
1 Expert Approved Answer
Step: 1 Unlock

Question Has Been Solved by an Expert!
Get step-by-step solutions from verified subject matter experts
Step: 2 Unlock
Step: 3 Unlock