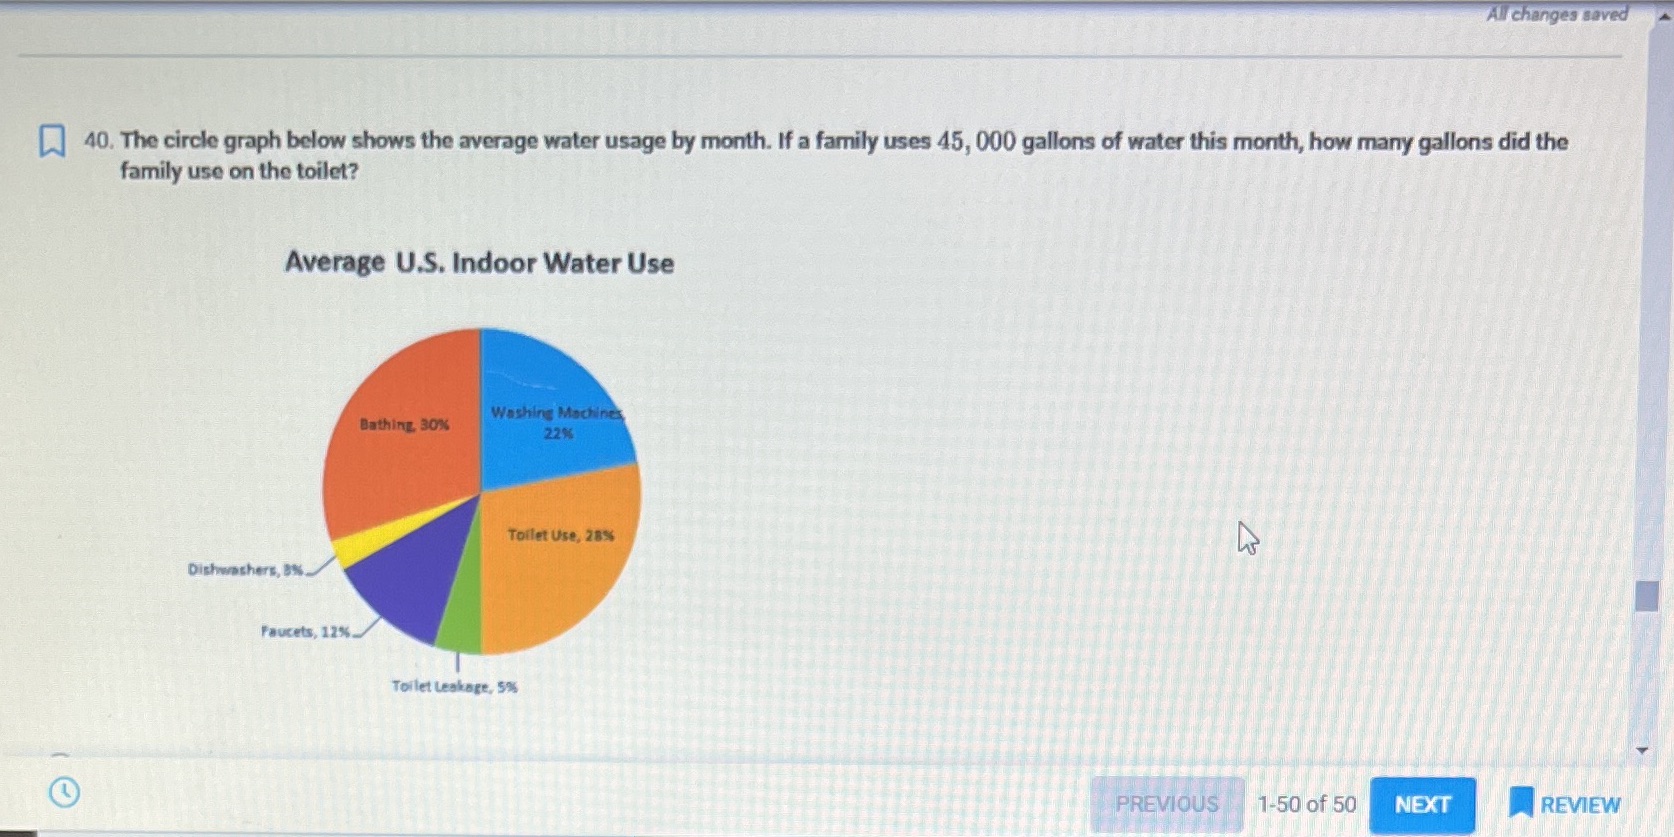
Question: All changes saved 40. The circle graph below shows the average water usage by month. If a family uses 45, 000 gallons of water this

All changes saved 40. The circle graph below
All changes saved 40. The circle graph below shows the average water usage by month. If a family uses 45, 000 gallons of water this month, how many gallons did the family use on the toilet? Average U.S. Indoor Water Use Bathing, 30% Washing Machines 22%% Toilet Use, 28% Dishwashers, BS. Faucets, 12%%. Toilet Leakage, 5% PREVIOUS 1-50 of 50 NEXT REVIEW

Step by Step Solution

There are 3 Steps involved in it

1 Expert Approved Answer
Step: 1 Unlock blur-text-image
Question Has Been Solved by an Expert!

Get step-by-step solutions from verified subject matter experts

Step: 2 Unlock
Step: 3 Unlock

Students Have Also Explored These Related Mathematics Questions!