

Question: all charts for each answer are below the questions. 5a. Consider these maps of severe weather reports for 2015 and severe weather reports for 2014.
all charts for each answer are below the questions.
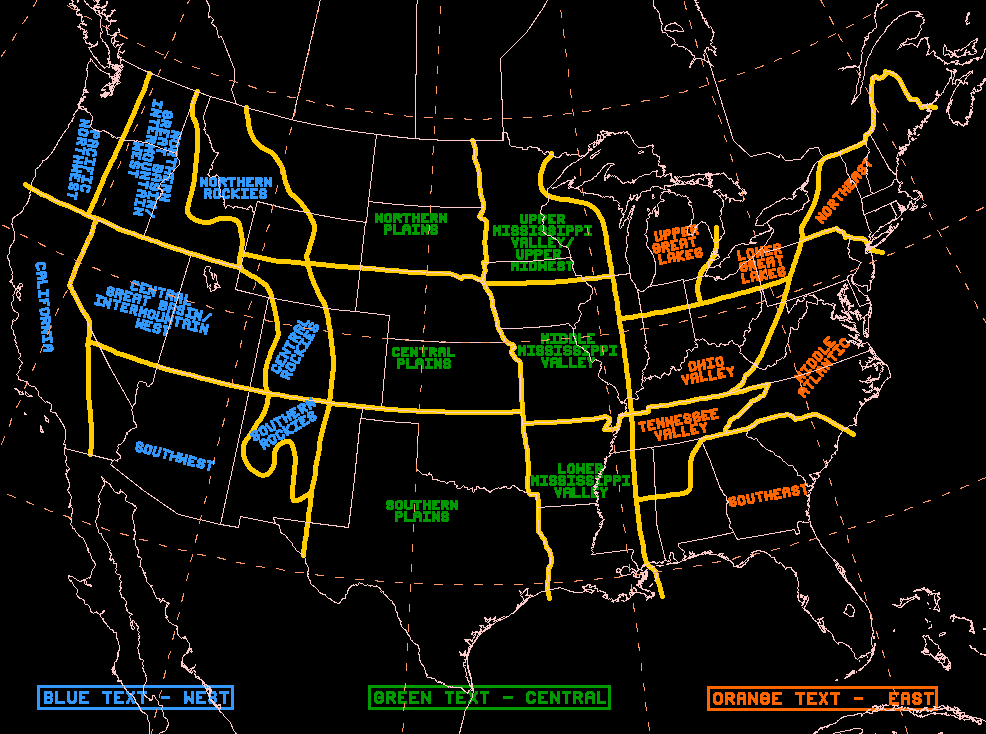
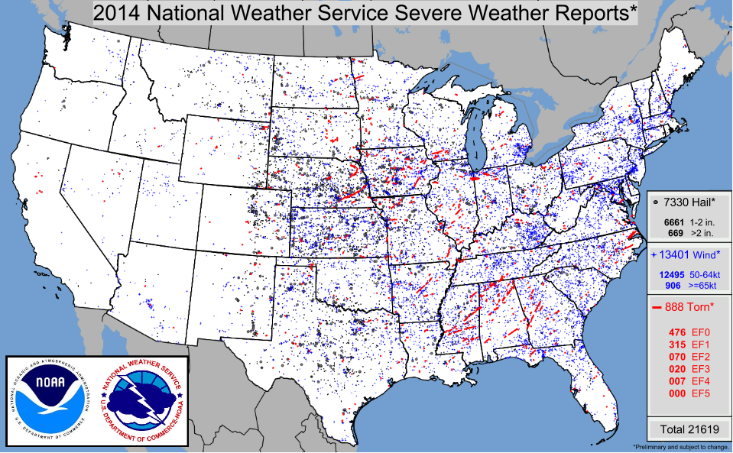
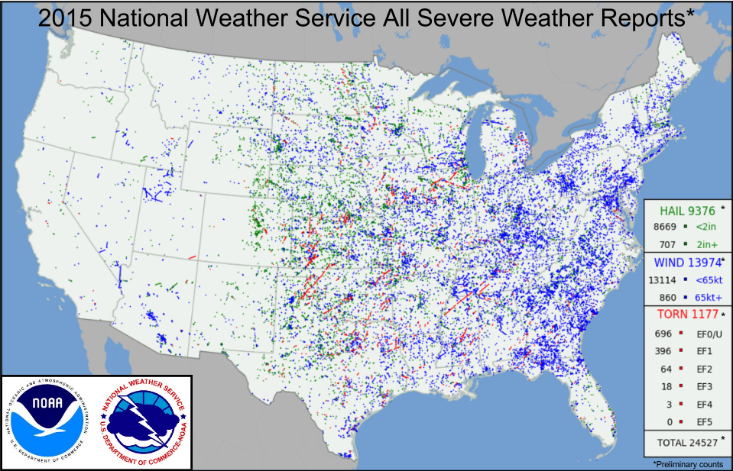
5a. Consider these maps of severe weather reports for 2015 and severe weather reports for 2014. Hail reports are shown in green, reports of damaging straight-line winds in blue, and reports of tornadoes in red). Broadly speaking, these years are representative of general severe weather patterns in the Lower 48 states. Of all the tornado reports, the percentage were violent tornadoes is ?, the percentage of strong tornadoes is ?, and the percentage of weak tornadoes (which includes those that were unrated) is ?. a) 0.1, 3.4, 96.5 b) 0.3, 5.8, 93.9 c) 0.5, 8.3, 91.2 d) 1.0, 12.7, 86.3
\f\f\f
Step by Step Solution
There are 3 Steps involved in it

Get step-by-step solutions from verified subject matter experts