

Question: ALL CODE NEEDS TO BE FOR MATLAB So I currently have some homework dealing with 2D Transient heat transfer. This is our figure. We had
ALL CODE NEEDS TO BE FOR MATLAB
So I currently have some homework dealing with 2D Transient heat transfer. This is our figure.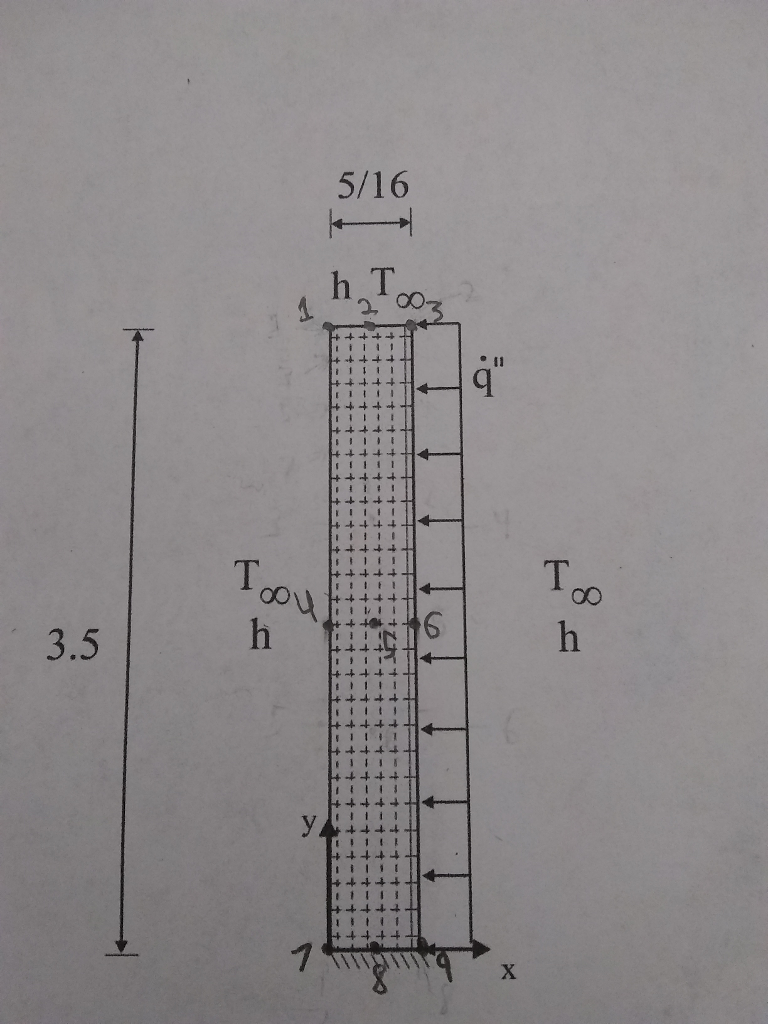
We had to derive 9 recursive formulas(using the 9 points I marked on the figure) to help us calculate the temperature across all 150 nodes within our figure(6 in x direction * 25 in y direction). We have to graph and find certain things in our code.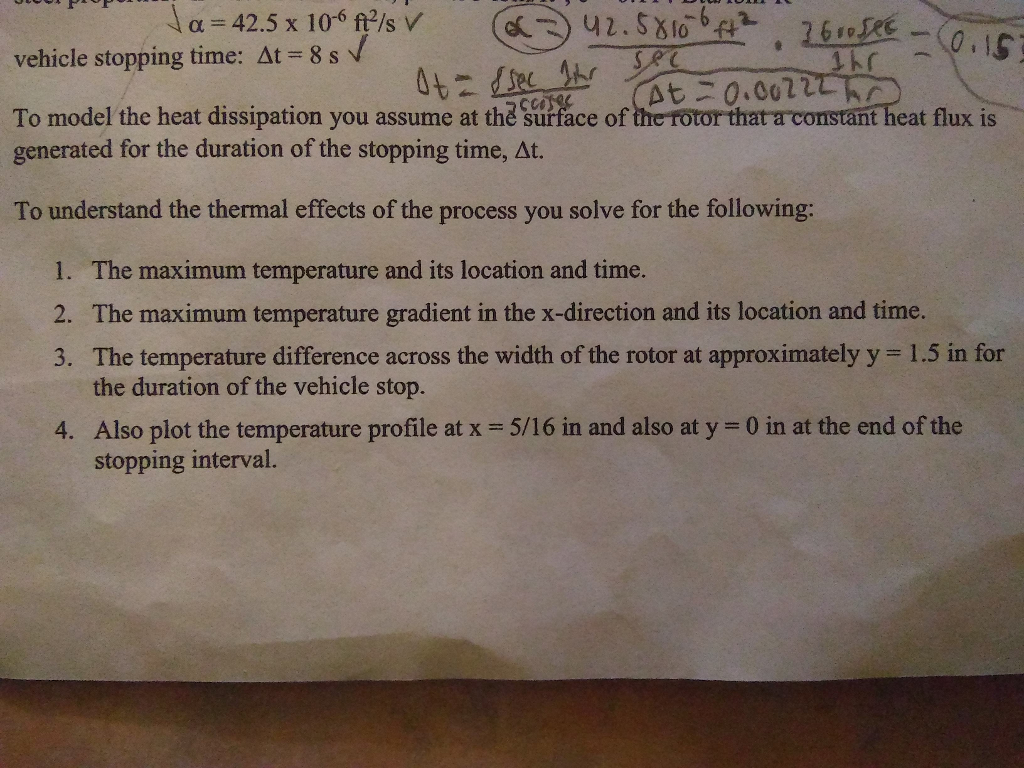
I have already derived the formulas and just need help coding to answer a few questions and graph some things. My formulas are in this form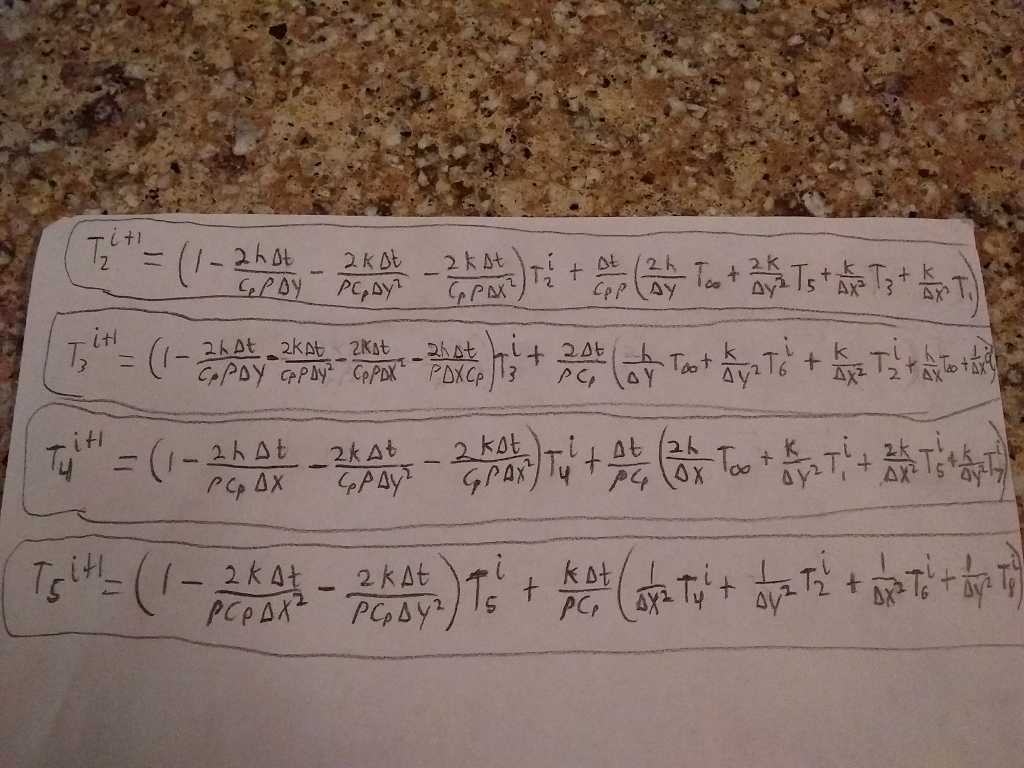
So far this is all I have for the code. It is from a 1D transient example my professor gave us. It's all we have to go off of and it's not very helpful and probably more misleading then anything. If someone could write the code out and set the forms for the equations then I can input them(like show me how id write T^i(1) in the T^i-1(1) equation)
% Program models transient 2-D % constants % Heat Transfer coefficient [Btu/sec-ft^2-F] h = 0.00555556; % spatial discretization [ft] dx = 0.004342; dy = 0.0116667; % Steel Properties % thermal diffusivity [ft^2/sec] a = 42.5*10^-6; % density [lbm/ft^3] p = 493; % constant [Btu/lbm-R] c = 0.114; % Constant heat flux generation [Btu/sec-ft^2] q = 2.8818; % Time stepping constants [sec] % initial time time = 0; % final time timef = 8; % maximum time step dtmax = 0.1924; % time step dt = dtmax; % Initialize node temperatures % j is the number of time steps taken. j = 1; % initialize temperatures for i = 1:9 T(1,i) = 1.; end % Begin integration. while (time(this EQ. is unfinished, didnt know how to write other temps)
% node 2 T(j,2) = ;
% node 3 T(j,3) = ;
% node 4 T(j,4) = ;
% node 5 T(j,5) = ;
% node 6 T(j,6) = ;
% node 7 T(j,7) = ;
% node 8 T(j,8) = ;
% node 9 T(j,9) = ; end; % save data to text file save my_data.out T -ASCII
% plot final temperature profile for i=1:9 x(i) = (i-1)*dx; end
plot(x,T);
EDIT: apparently the images are blurry, they look fine on my end so I uploaded them to imgur and am linking them below.
Image 1(figure): https://imgur.com/a/JXUVD
Image 2(things that need to be solved through matlab code): https://imgur.com/PaVi9Lc
Image 3(equation forms, these do not need to be inputed. i can do that, just show me where they should go): https://imgur.com/im6zbJ7
T.-+-+-+-+-+-+-+-+-+-+-+-+?tar t : 1-1-1-+-+-+-+-+-+-+ t-t-t-1"t-t 3 T.-+-+-+-+-+-+-+-+-+-+-+-+?tar t : 1-1-1-+-+-+-+-+-+-+ t-t-t-1"t-t 3
Step by Step Solution
There are 3 Steps involved in it

Get step-by-step solutions from verified subject matter experts