

Question: All data, graphs, and information is included under each question. Please answer questions 5-9 below 5. The owner of a mail-order catalog would like to
All data, graphs, and information is included under each question. Please answer questions 5-9 below
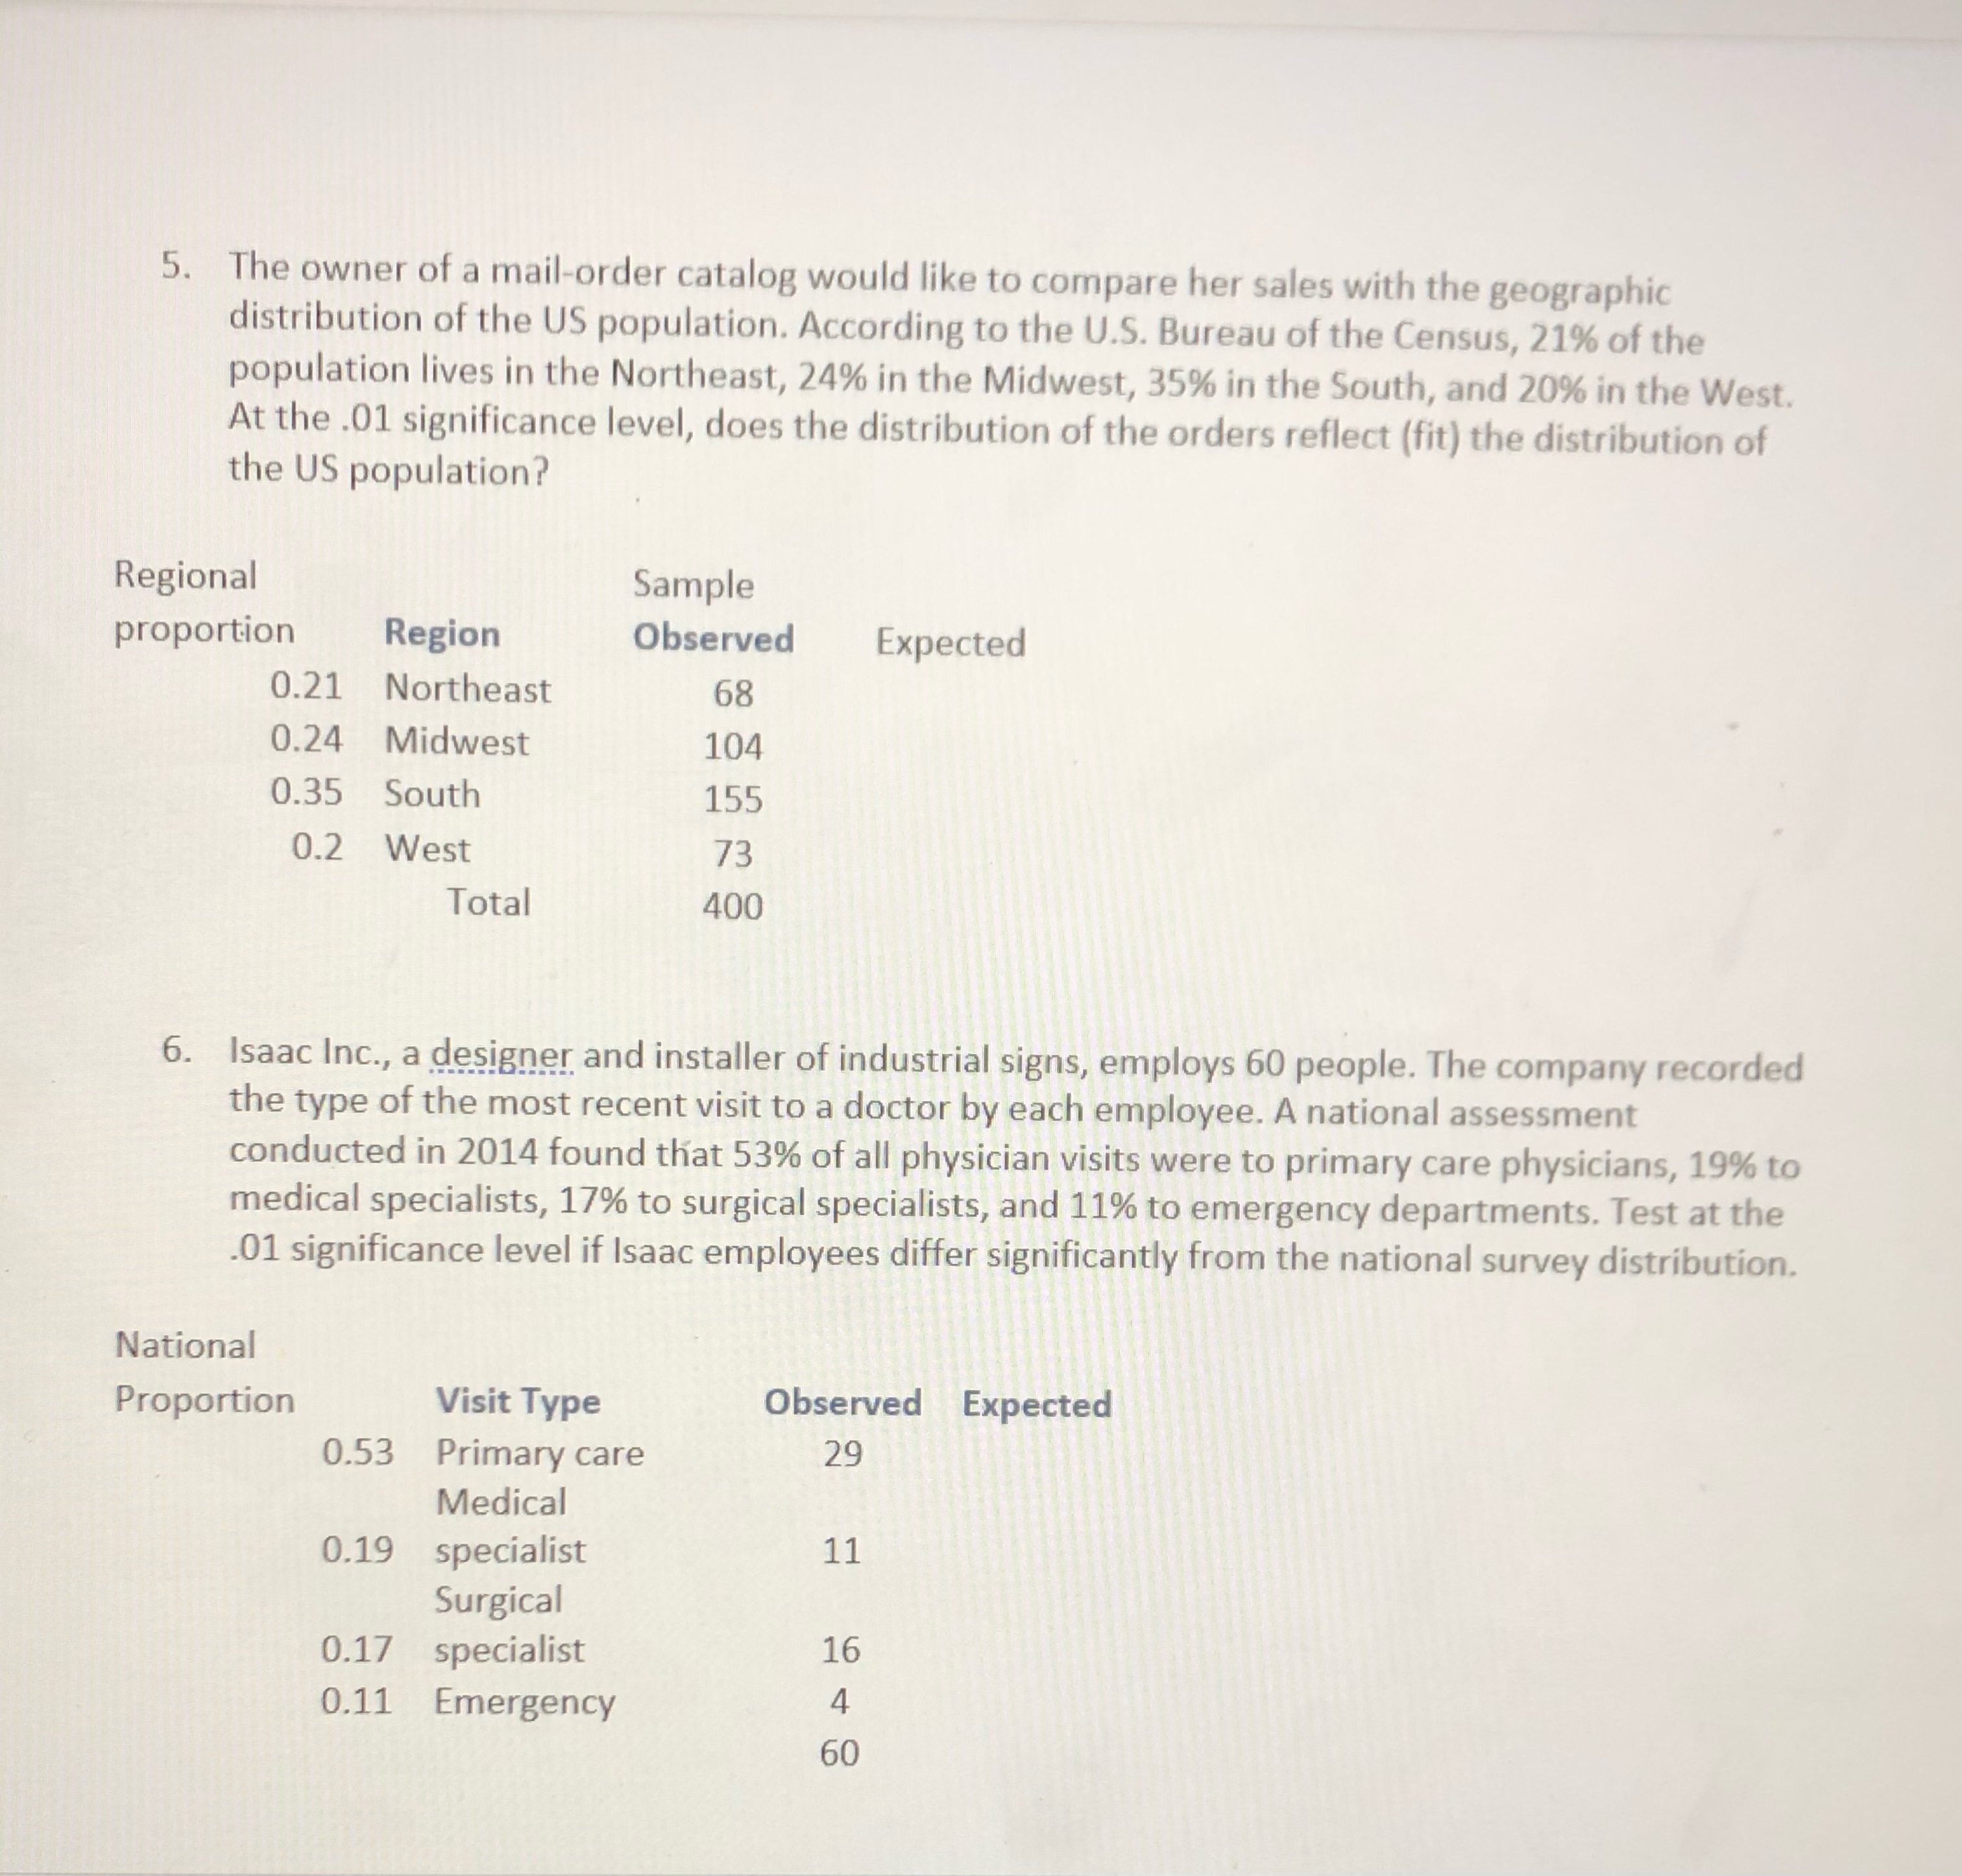
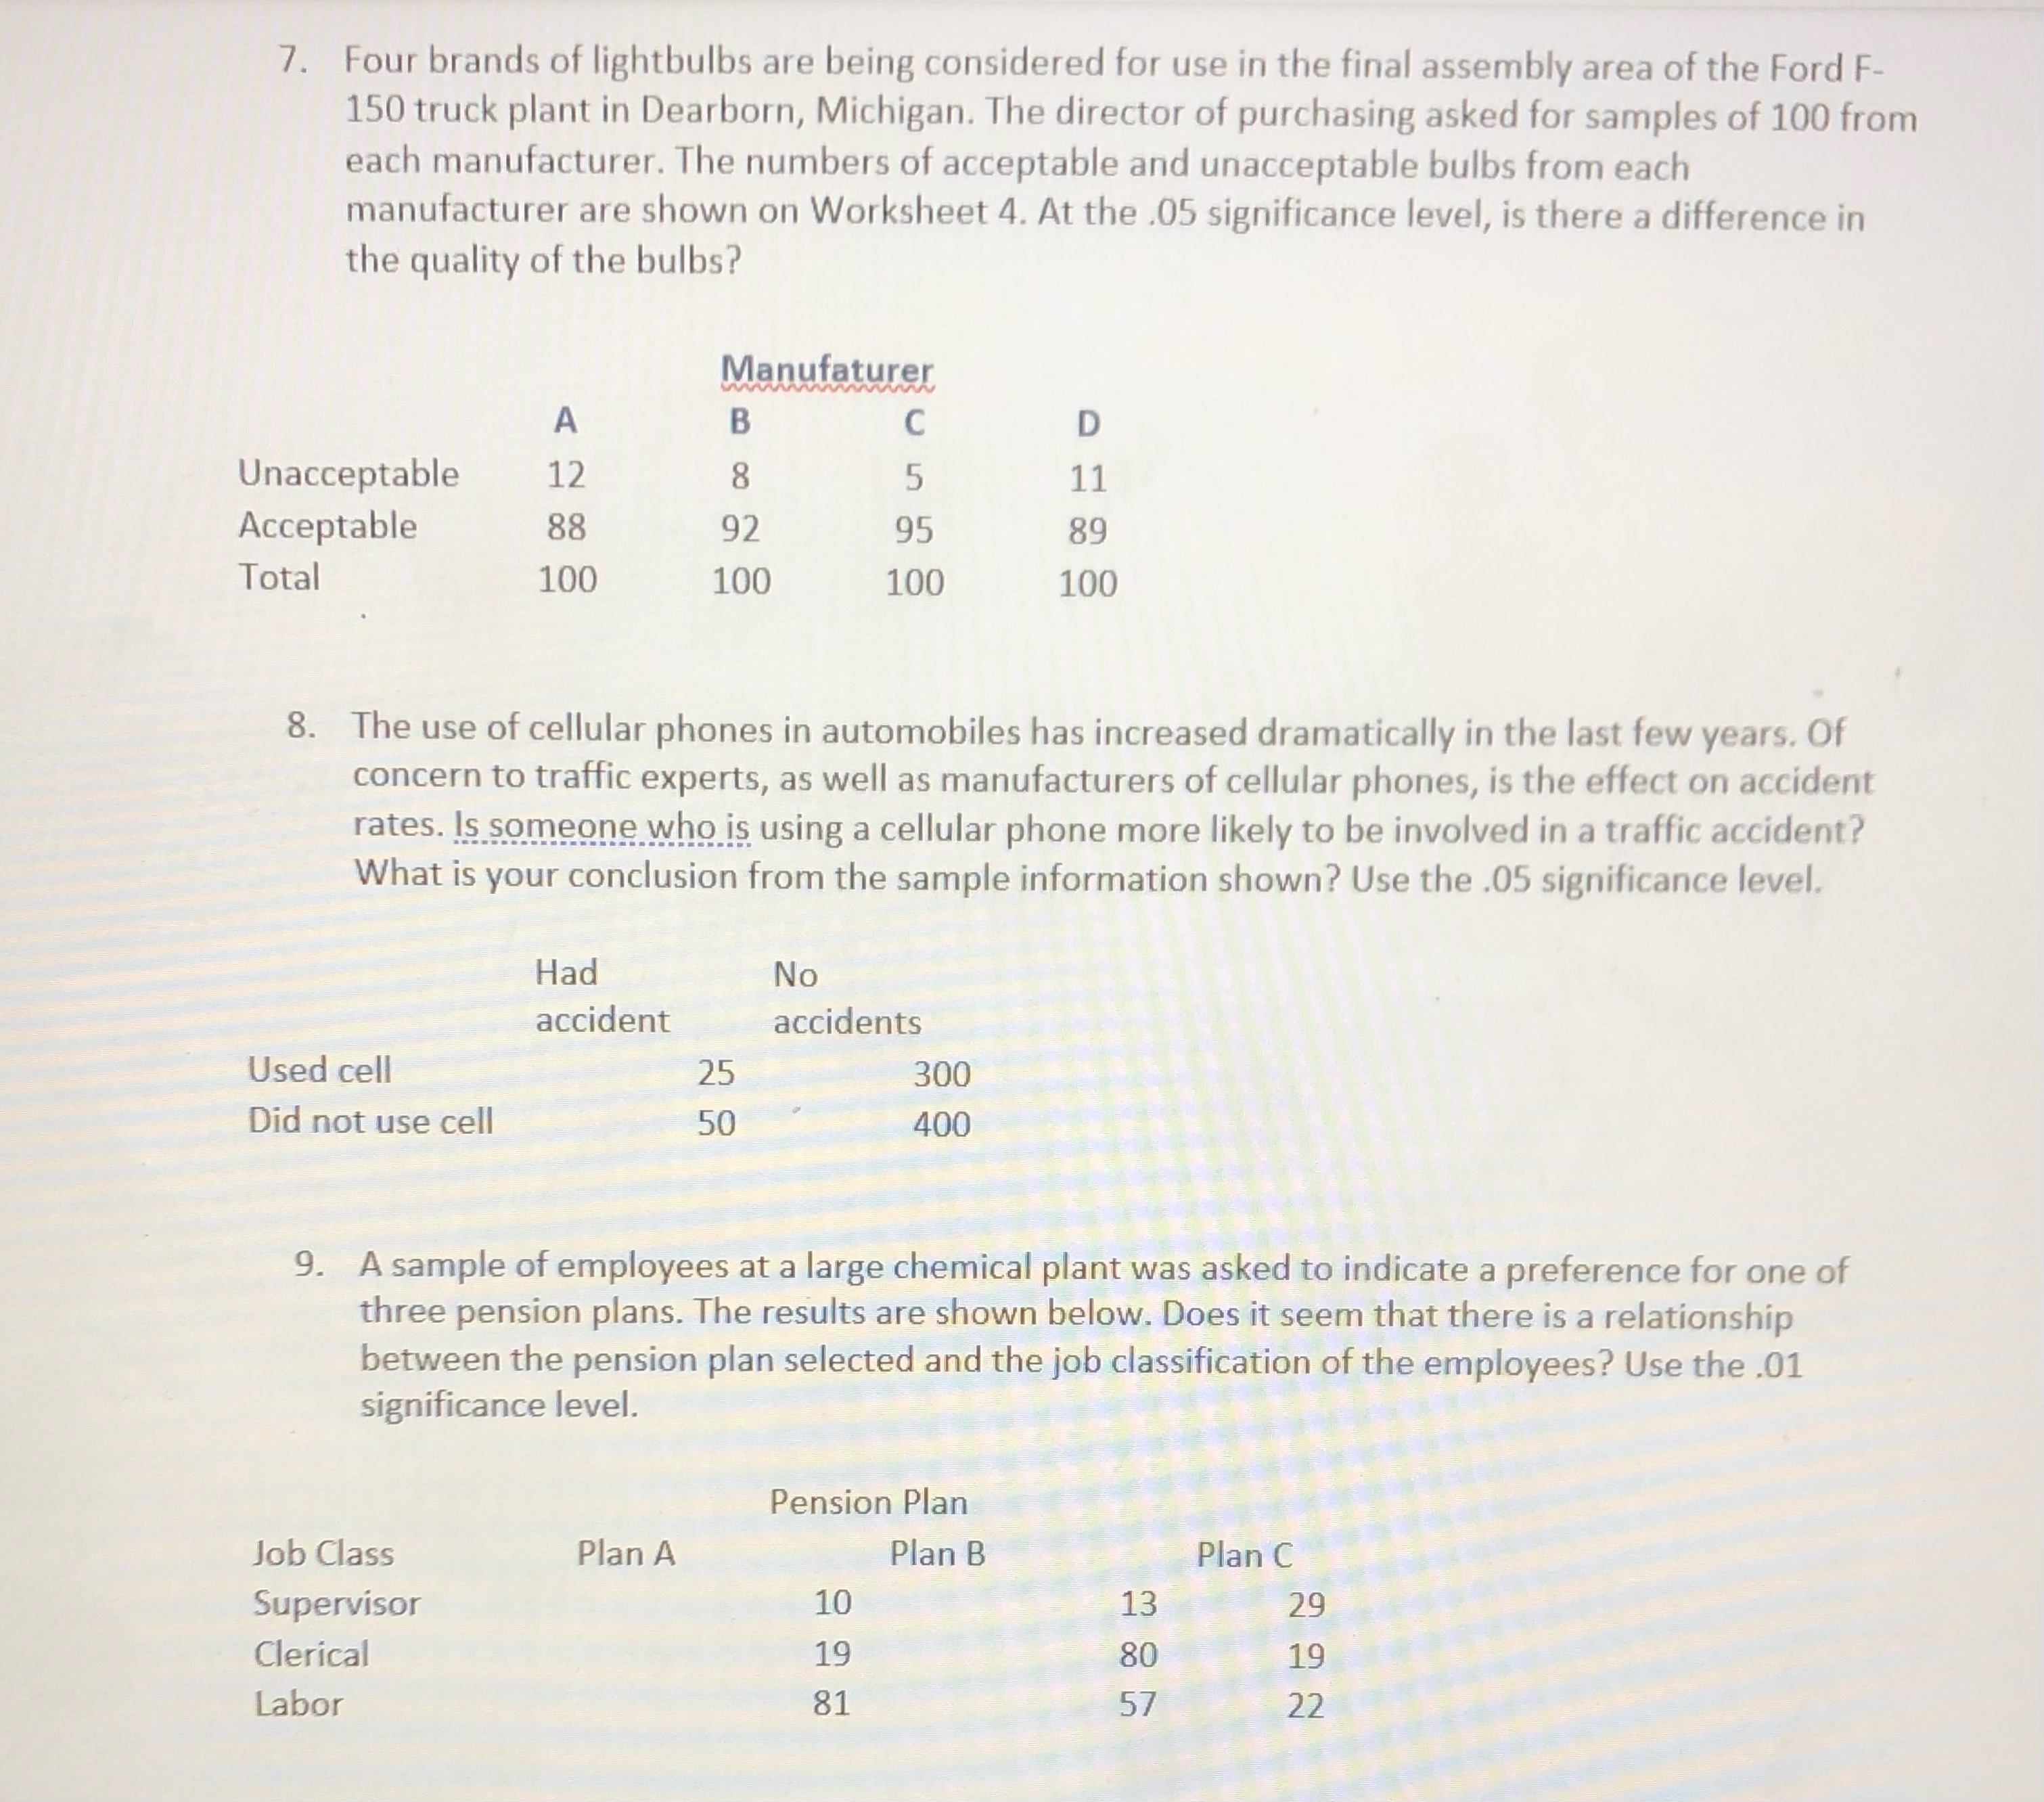
5. The owner of a mail-order catalog would like to compare her sales with the geographic distribution of the US population. According to the U.S. Bureau of the Census, 21% of the population lives in the Northeast, 24% in the Midwest, 35% in the South, and 20% in the West. At the .01 significance level, does the distribution of the orders reflect (fit) the distribution of the US population? Regional Sample proportion Region Observed Expected 0.21 Northeast 68 0.24 Midwest 104 0.35 South 155 0.2 West 73 Total 400 6. Isaac Inc., a designer and installer of industrial signs, employs 60 people. The company recorded the type of the most recent visit to a doctor by each employee. A national assessment conducted in 2014 found that 53% of all physician visits were to primary care physicians, 19% to medical specialists, 17% to surgical specialists, and 11% to emergency departments. Test at the .01 significance level if Isaac employees differ significantly from the national survey distribution. National Proportion Visit Type Observed Expected 0.53 Primary care 29 Medical 0.19 specialist 11 Surgical 0.17 specialist 16 0.11 Emergency 4 607. Four brands of lightbulbs are being considered for use in the final assembly area of the Ford F- 150 truck plant in Dearborn, Michigan. The director of purchasing asked for samples of 100 from each manufacturer. The numbers of acceptable and unacceptable bulbs from each manufacturer are shown on Worksheet 4. At the .05 significance level, is there a difference in the quality of the bulbs? Manufaturer A B C D Unacceptable 12 8 5 11 Acceptable 88 92 95 89 Total 100 100 100 100 8. The use of cellular phones in automobiles has increased dramatically in the last few years. Of concern to traffic experts, as well as manufacturers of cellular phones, is the effect on accident rates. Is someone who is using a cellular phone more likely to be involved in a traffic accident? What is your conclusion from the sample information shown? Use the .05 significance level. Had No accident accidents Used cell 25 300 Did not use cell 50 400 9. A sample of employees at a large chemical plant was asked to indicate a preference for one of three pension plans. The results are shown below. Does it seem that there is a relationship between the pension plan selected and the job classification of the employees? Use the .01 significance level. Pension Plan Job Class Plan A Plan B Plan C Supervisor 10 13 29 Clerical 19 80 19 Labor 81 57 22
Step by Step Solution
There are 3 Steps involved in it

Get step-by-step solutions from verified subject matter experts