

Question: All data in real $ bn. On the graph below, the horizontal distance between AD0 and AD1 is 317. If the initial increase in autonomous
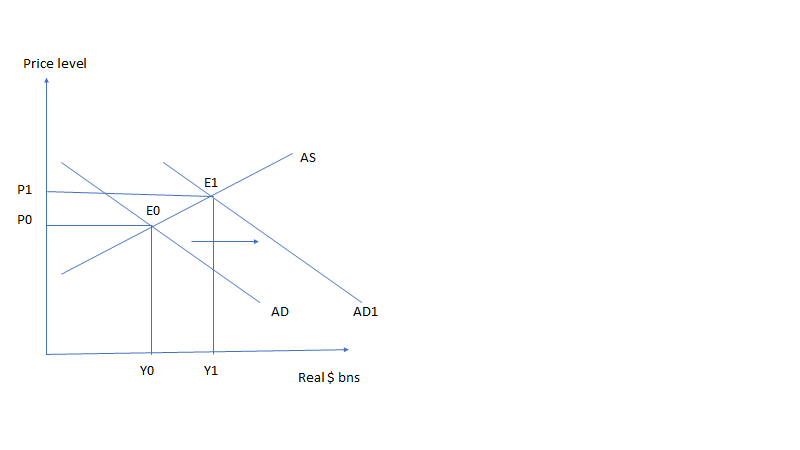
All data in real $ bn. On the graph below, the horizontal distance between AD0 and AD1 is 317. If the initial increase in autonomous consumption that caused this rightward shift was 111, what does that tell us?

Price level AS P1 E1 EO PO AD AD1 YO Y1 Real $ bns
Step by Step Solution
There are 3 Steps involved in it
1 Expert Approved Answer
Step: 1 Unlock

Question Has Been Solved by an Expert!
Get step-by-step solutions from verified subject matter experts
Step: 2 Unlock
Step: 3 Unlock