

Question: All data is filled out, but not sure how to create a time-series plot of net income, net sales, and profit margin ratio for the
 All data is filled out, but not sure how to create a time-series plot of net income, net sales, and profit margin ratio for the two firms into one figure using Excel. Please help and show steps on Excel if possible :)
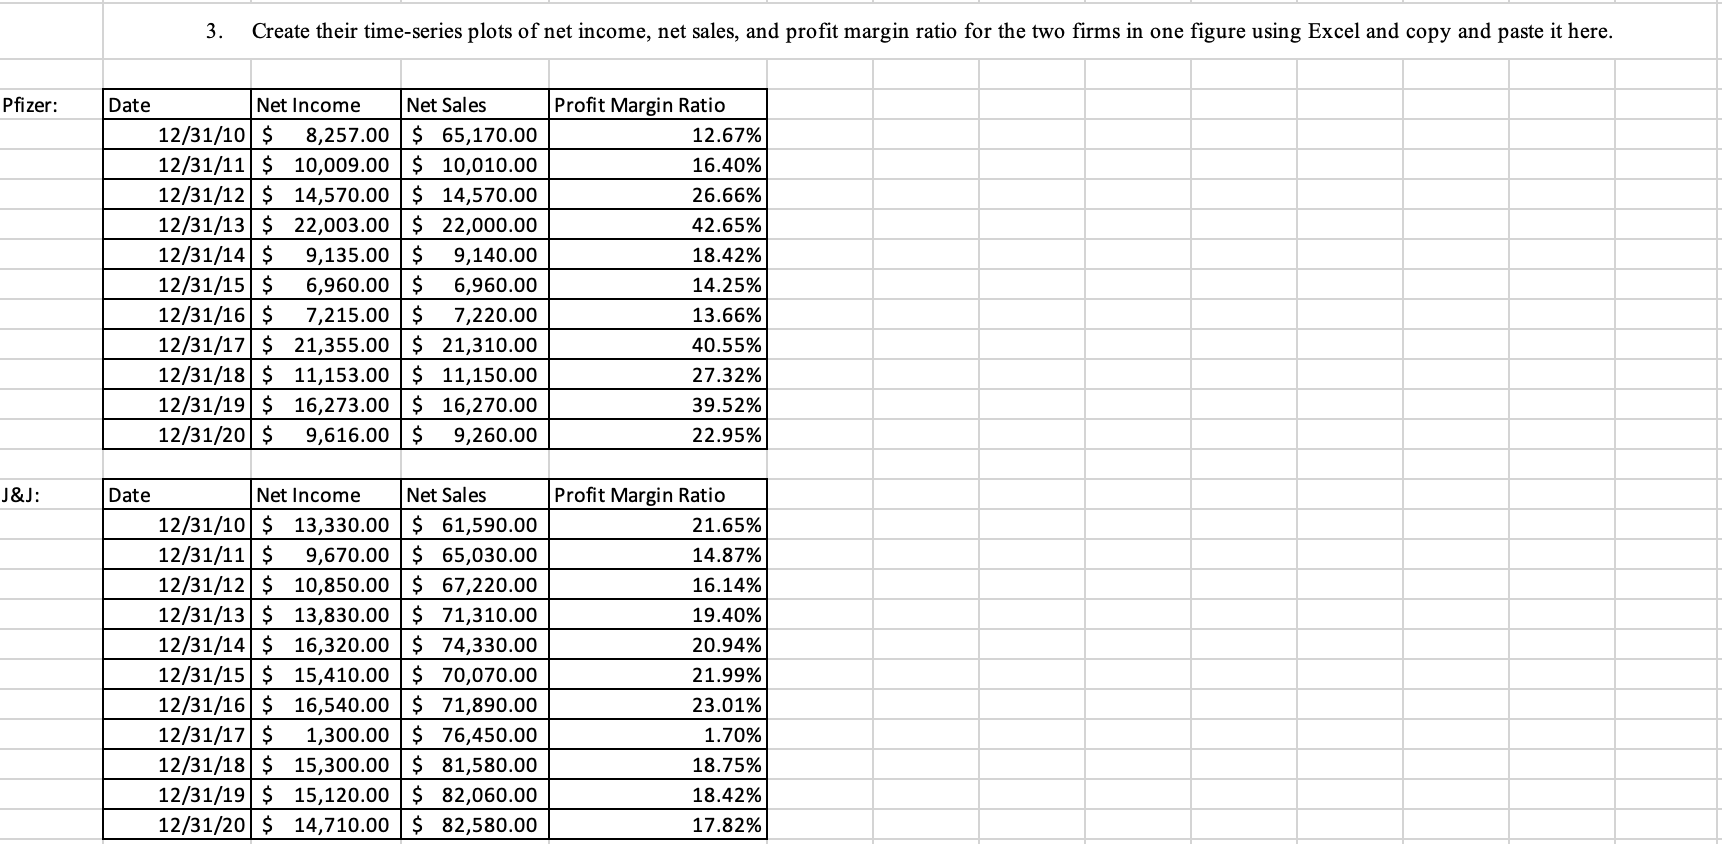
3. Create their time-series plots of net income, net sales, and profit margin ratio for the two firms in one figure using Excel and copy and paste it here. Pfizer: Date Net Income Net Sales Profit Margin Ratio 12/31/10$ 8,257.00 $ 65,170.00 12.67% 12/31/11 $ 10,009.00 $ 10,010.00 16.40% 12/31/12 $ 14,570.00 $ 14,570.00 26.66% 12/31/13 $ 22,003.00 $ 22,000.00 42.65% 12/31/14 $ 9,135.00 $ 9,140.00 18.42% 12/31/15$ 6,960.00 $ 6,960.00 14.25% 12/31/16 $ 7,215.00 $ 7,220.00 13.66% 12/31/17 $ 21,355.00 $ 21,310.00 40.55% 12/31/18 $ 11,153.00 $ 11,150.00 27.32% 12/31/19 $ 16,273.00 $ 16,270.00 39.52% 12/31/20 $ 9,616.00 $ 9,260.00 22.95% J&J: Date Net Income Net Sales 12/31/10 $ 13,330.00 $ 61,590.00 12/31/11 $ 9,670.00 $ 65,030.00 12/31/12 $ 10,850.00 $ 67,220.00 12/31/13 $ 13,830.00 $ 71,310.00 12/31/14 $ 16,320.00 $ 74,330.00 12/31/15 $ 15,410.00 $ 70,070.00 12/31/16 $ 16,540.00 $ 71,890.00 12/31/17 $ 1,300.00 $ 76,450.00 12/31/18 $ 15,300.00 $ 81,580.00 12/31/19 $ 15,120.00 $ 82,060.00 12/31/20 $ 14,710.00 $ 82,580.00 Profit Margin Ratio 21.65% 14.87% 16.14% 19.40% 20.94% 21.99% 23.01% 1.70% 18.75% 18.42% 17.82% 3. Create their time-series plots of net income, net sales, and profit margin ratio for the two firms in one figure using Excel and copy and paste it here. Pfizer: Date Net Income Net Sales Profit Margin Ratio 12/31/10$ 8,257.00 $ 65,170.00 12.67% 12/31/11 $ 10,009.00 $ 10,010.00 16.40% 12/31/12 $ 14,570.00 $ 14,570.00 26.66% 12/31/13 $ 22,003.00 $ 22,000.00 42.65% 12/31/14 $ 9,135.00 $ 9,140.00 18.42% 12/31/15$ 6,960.00 $ 6,960.00 14.25% 12/31/16 $ 7,215.00 $ 7,220.00 13.66% 12/31/17 $ 21,355.00 $ 21,310.00 40.55% 12/31/18 $ 11,153.00 $ 11,150.00 27.32% 12/31/19 $ 16,273.00 $ 16,270.00 39.52% 12/31/20 $ 9,616.00 $ 9,260.00 22.95% J&J: Date Net Income Net Sales 12/31/10 $ 13,330.00 $ 61,590.00 12/31/11 $ 9,670.00 $ 65,030.00 12/31/12 $ 10,850.00 $ 67,220.00 12/31/13 $ 13,830.00 $ 71,310.00 12/31/14 $ 16,320.00 $ 74,330.00 12/31/15 $ 15,410.00 $ 70,070.00 12/31/16 $ 16,540.00 $ 71,890.00 12/31/17 $ 1,300.00 $ 76,450.00 12/31/18 $ 15,300.00 $ 81,580.00 12/31/19 $ 15,120.00 $ 82,060.00 12/31/20 $ 14,710.00 $ 82,580.00 Profit Margin Ratio 21.65% 14.87% 16.14% 19.40% 20.94% 21.99% 23.01% 1.70% 18.75% 18.42% 17.82%
Step by Step Solution
There are 3 Steps involved in it

Get step-by-step solutions from verified subject matter experts