

Question: All data provided! Thank you! 17.6 (I had to scroll down) Consider the following time series data. b. Show the four-quarter and centered moving average
All data provided! Thank you! 17.6 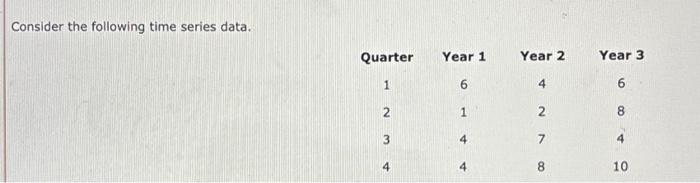
(I had to scroll down)
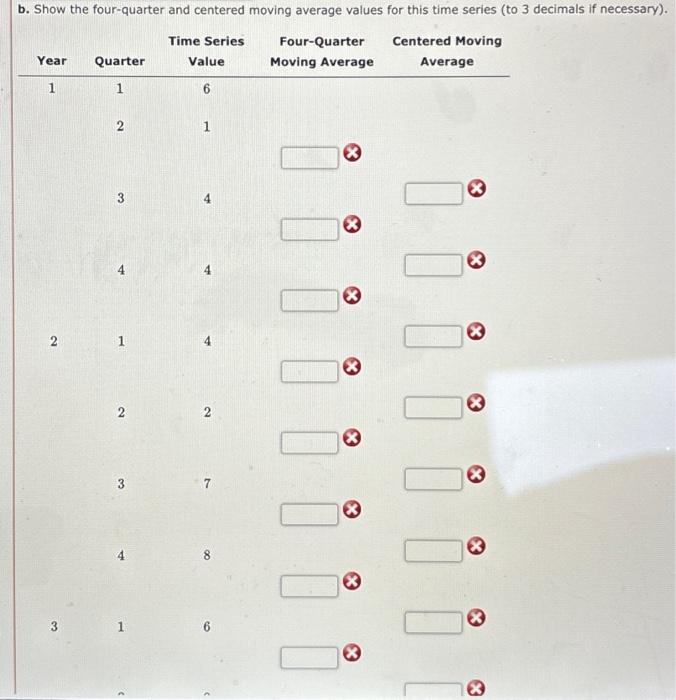
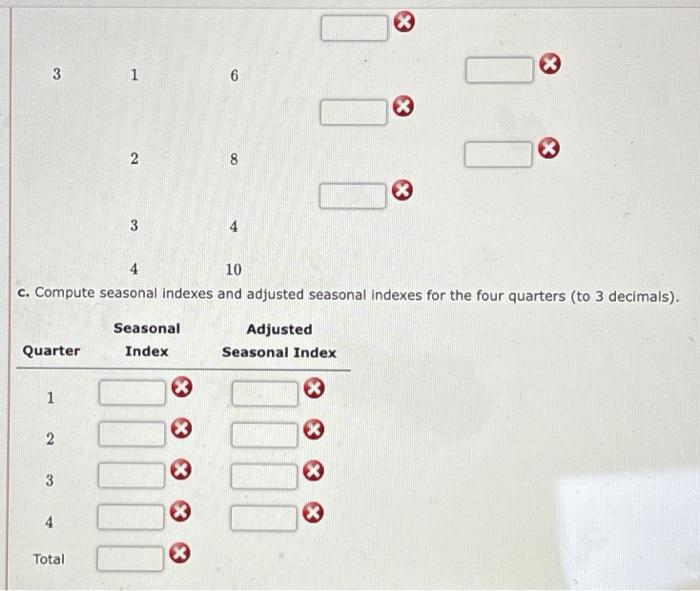
Consider the following time series data. b. Show the four-quarter and centered moving average values for this time series (to 3 decimals if necessary). \begin{tabular}{ccccc} Year & Quarter & \begin{tabular}{c} Time Series \\ Value \end{tabular} & \begin{tabular}{c} Four-Quarter \\ Moving Average \end{tabular} & \begin{tabular}{c} Centered Moving \\ Average \end{tabular} \\ \hline 1 & 1 & 6 & \\ & 2 & 1 & \end{tabular} 3 4 2 1 2 3 4 8 3 4 4 4 2 7 8 6 8 (2) 2 (2) 0 (2) (2) 3 8 c. Compute seasonal indexes and adjusted seasonal indexes for the four quarters (to 3 decimals)
Step by Step Solution
There are 3 Steps involved in it
1 Expert Approved Answer
Step: 1 Unlock

Question Has Been Solved by an Expert!
Get step-by-step solutions from verified subject matter experts
Step: 2 Unlock
Step: 3 Unlock