

Question: All Excel work. Thanks! 1. a) Using the VLOOKUP function in Microsoft Excel create a new variable called 'class' which identifies customers as low income,
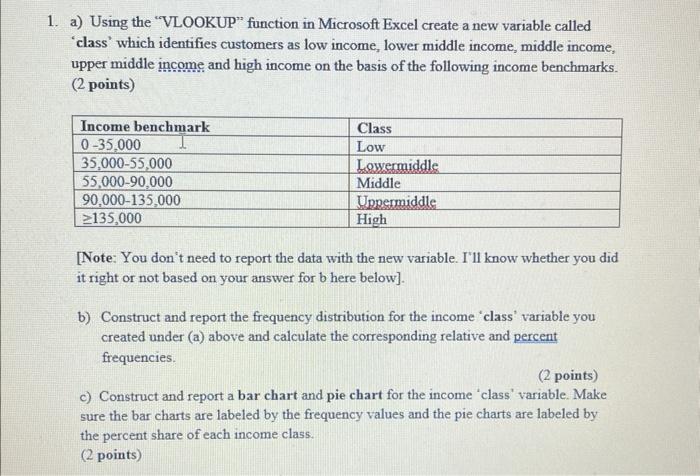
1. a) Using the "VLOOKUP" function in Microsoft Excel create a new variable called 'class' which identifies customers as low income, lower middle income, middle income, upper middle income and high income on the basis of the following income benchmarks. (2 points) [Note: You don't need to report the data with the new variable. I'll know whether you did it right or not based on your answer for b here below]. b) Construct and report the frequency distribution for the income 'class' variable you created under (a) above and calculate the corresponding relative and percent frequencies. (2 points) c) Construct and report a bar chart and pie chart for the income 'class' variable. Make sure the bar charts are labeled by the frequency values and the pie charts are labeled by the percent share of each income class. (2 points)
Step by Step Solution
There are 3 Steps involved in it

Get step-by-step solutions from verified subject matter experts