

Question: All I need is a graph that looks like this attachment for an R coding chunk.... I am using a website to create single column
All I need is a graph that looks like this attachment for an R coding chunk....
I am using a website to create single column graph of top ten words by decade. This will require creating one graph each per decade then arranging them into one graph OF TWO ROWS! The top row will be 1980s and 1990s, and bottom row 2000s and 2010s. . The y-axis on all four graphs should be labeled "Count" and the x-axes labeled "Word". Each individual graph should have as a title the decade and the main title of the "Top Ten Words by Decade." Each graph should use a different color. I'm supposed to use the grid.arrange() function to help.
One thing that was told to help was to go to this website, https://cran.r-project.org/web/packages/egg/vignettes/Ecosystem.html to find information about using the grid.arrange() function.
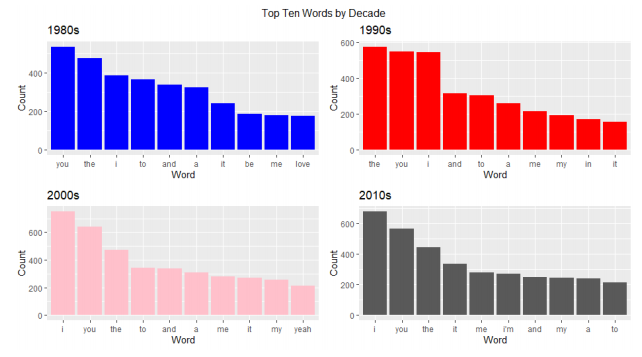
Top Ten Words by Decade 1980s 1990s 600- 400- Count Count 200 - YOU The to and it be me love the YOU and to E me in it Word Word 2000s 2010s 600 - 600- 400- Count Count 400 200- 200 - YOU the to and me it my yeah YOU the it me i'm and Im to Word Word
Step by Step Solution
There are 3 Steps involved in it

Get step-by-step solutions from verified subject matter experts