

Question: all infomation given sines... Given the data here. E a. Compute the average return for each of the assets from 1929 to 1940 (the Great
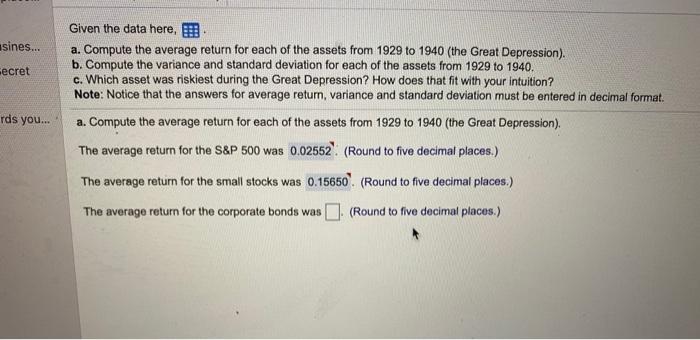
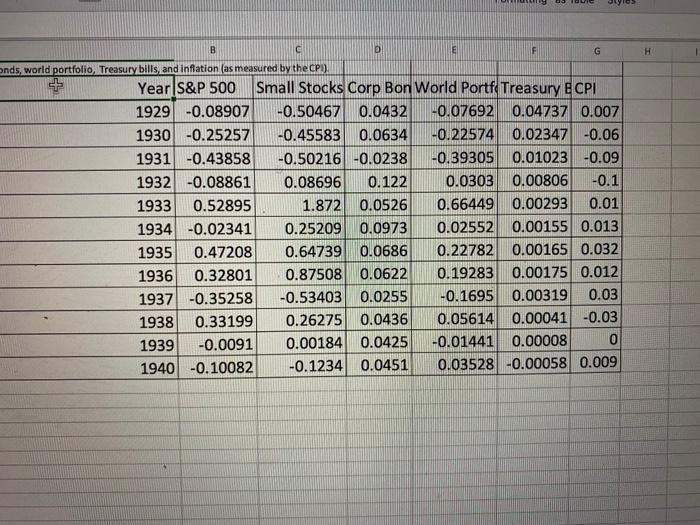
sines... Given the data here. E a. Compute the average return for each of the assets from 1929 to 1940 (the Great Depression). b. Compute the variance and standard deviation for each of the assets from 1929 to 1940. c. Which asset was riskiest during the Great Depression? How does that fit with your intuition? Note: Notice that the answers for average return, variance and standard deviation must be entered in decimal format. Fecret Tds you. a. Compute the average return for each of the assets from 1929 to 1940 (the Great Depression). The average return for the S&P 500 was 0.02552(Round to five decimal places.) The average return for the small stocks was 0.15650 (Round to five decimal places.) The average return for the corporate bonds was (Round to five decimal places.) olyo B c 0 G H onds, world portfolio Treasury bills, and inflation (as measured by the CPI). Year S&P 500 Small Stocks Corp Bon World Portfe Treasury ECPI 1929 -0.08907 -0.50467 0.0432 -0.07692 0.04737 0.007 1930 -0.25257 -0.45583 0.0634 -0.22574 0.02347 -0.06 1931 -0.43858 -0.50216 -0.0238 -0.39305 0.01023 -0.09 1932 -0.08861 0.08696 0.122 0.0303 0.00806 -0.1 1933 0.52895 1.872 0.0526 0.66449 0.00293 0.01 1934 -0.02341 0.25209 0.0973 0.02552 0.00155 0.013 1935 0.47208 0.64739 0.0686 0.22782 0.00165 0.032 1936 0.32801 0.87508 0.0622 0.19283 0.00175 0.012 1937 -0.35258 -0.53403 0.0255 -0.1695 0.00319 0.03 1938 0.33199 0.26275 0.0436 0.05614 0.00041 -0.03 1939 -0.0091 0.00184 0.0425 -0.01441 0.00008 0 1940 -0.10082 -0.1234 0.0451 0.03528 -0.00058 0.009
Step by Step Solution
There are 3 Steps involved in it

Get step-by-step solutions from verified subject matter experts