

Question: All information is included below. Please include formulas as well. CVP Model and Budget The purpose of this project is twofold: It will give you
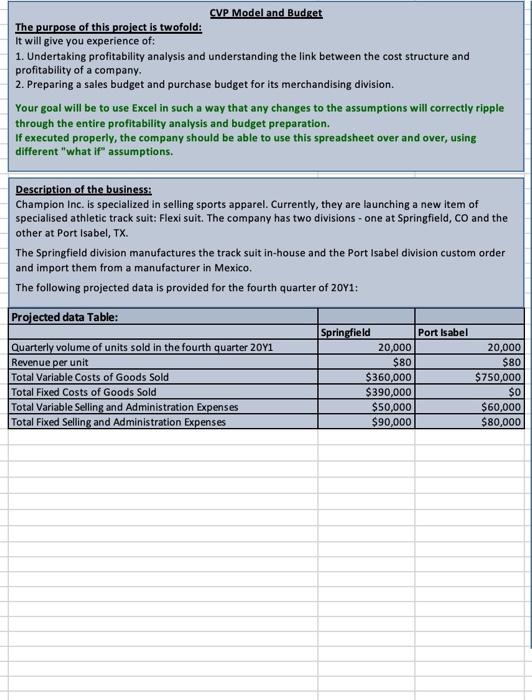
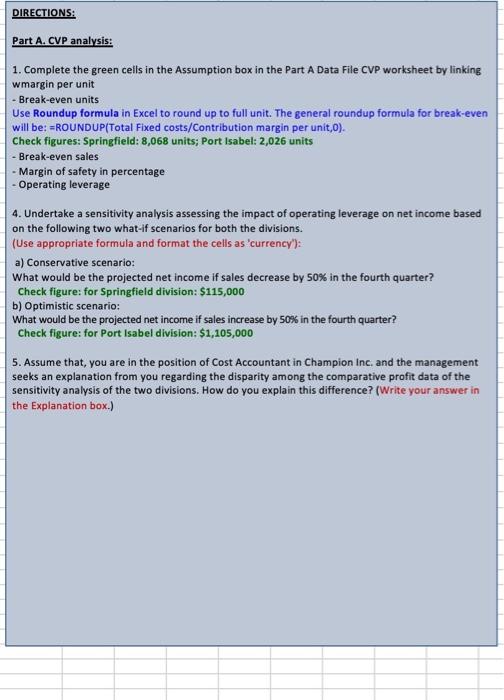
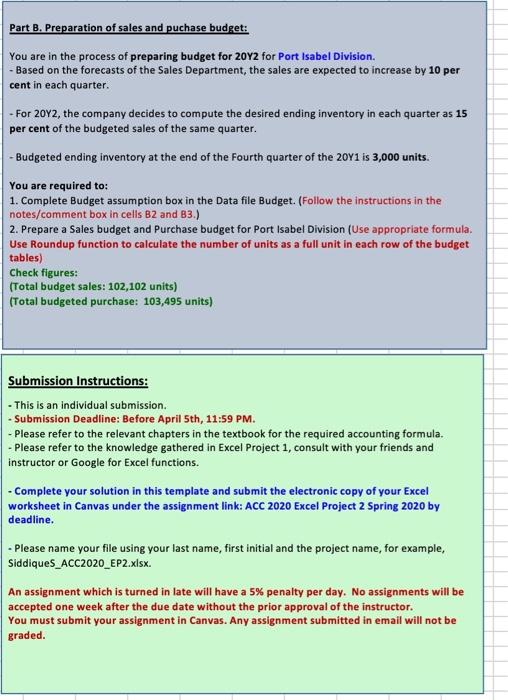
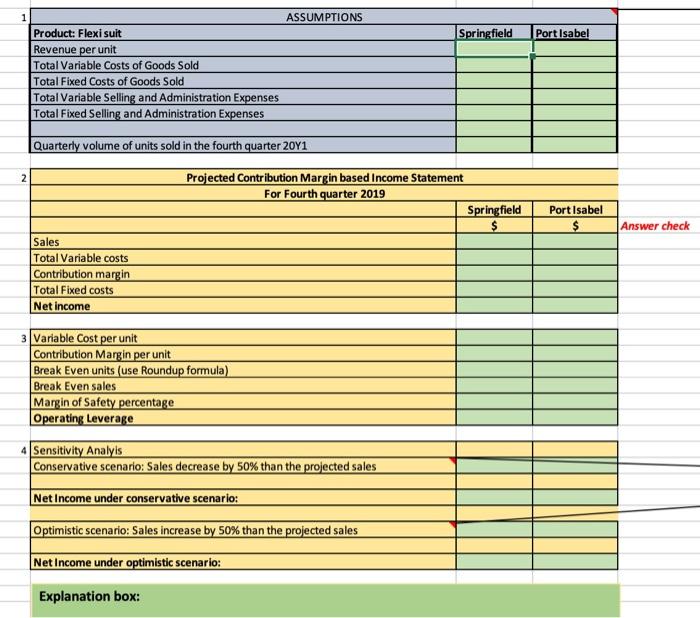
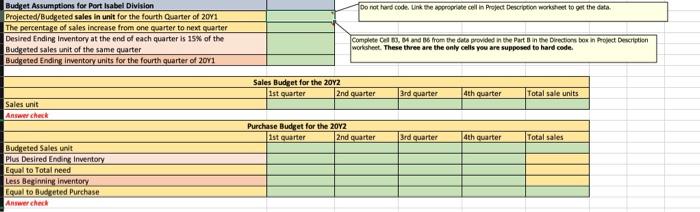
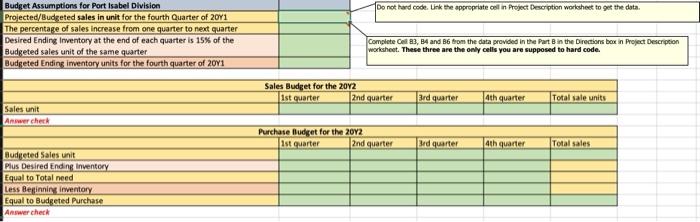
CVP Model and Budget The purpose of this project is twofold: It will give you experience of: 1. Undertaking profitability analysis and understanding the link between the cost structure and profitability of a company. 2. Preparing a sales budget and purchase budget for its merchandising division. Your goal will be to use Excel in such a way that any changes to the assumptions will correctly ripple through the entire profitability analysis and budget preparation. If executed properly, the company should be able to use this spreadsheet over and over, using different "what if" assumptions. Description of the business: Champion Inc. is specialized in selling sports apparel. Currently, they are launching a new item of specialised athletic track suit: Flexi suit. The company has two divisions - one at Springfield, CO and the other at Port Isabel, TX. The Springfield division manufactures the track suit in-house and the Port Isabel division custom order and import them from a manufacturer in Mexico. The following projected data is provided for the fourth quarter of 2011: Projected data Table: Quarterly volume of units sold in the fourth quarter 2011 Revenue per unit Total Variable costs of Goods Sold Total Fixed Costs of Goods Sold Total Variable Selling and Administration Expenses Total Fixed Selling and Administration Expenses Springfield Port Isabel 20,000 20,000 $80 $80 $360,000 $750,000 $390,000 $0 $50,000 $60,000 $90,000 $80,000 DIRECTIONS: Part A. CVP analysis: 1. Complete the green cells in the Assumption box in the Part A Data File CVP worksheet by linking wmargin per unit - Break-even units Use Roundup formula in Excel to round up to full unit. The general roundup formula for break-even will be: =ROUNDUP(Total Fixed costs/Contribution margin per unit,0). Check figures: Springfield: 8,068 units; Port Isabel: 2,026 units - Break-even sales - Margin of safety in percentage - Operating leverage 4. Undertake a sensitivity analysis assessing the impact of operating leverage on net income based on the following two what-if scenarios for both the divisions. (Use appropriate formula and format the cells as 'currency"): a) Conservative scenario: What would be the projected net income if sales decrease by 50% in the fourth quarter? Check figure: for Springfield division: $115,000 b) Optimistic scenario: What would be the projected net income if sales increase by 50% in the fourth quarter? Check figure: for Port Isabel division: $1,105,000 5. Assume that, you are in the position of Cost Accountant in Champion Inc. and the management seeks an explanation from you regarding the disparity among the comparative profit data of the sensitivity analysis of the two divisions. How do you explain this difference? (Write your answer in the Explanation box.) Part B. Preparation of sales and puchase budget: You are in the process of preparing budget for 20Y2 for Port Isabel Division. - Based on the forecasts of the Sales Department, the sales are expected to increase by 10 per cent in each quarter. - For 20Y2, the company decides to compute the desired ending inventory in each quarter as 15 per cent of the budgeted sales of the same quarter. - Budgeted ending inventory at the end of the Fourth quarter of the 20Y1 is 3,000 units. You are required to: 1. Complete Budget assumption box in the Data file Budget. (Follow the instructions in the notes/comment box in cells B2 and 83.) 2. Prepare a Sales budget and Purchase budget for Port Isabel Division (Use appropriate formula. Use Roundup function to calculate the number of units as a full unit in each row of the budget tables) Check figures: (Total budget sales: 102,102 units) (Total budgeted purchase: 103,495 units) Submission Instructions: - This is an individual submission. - Submission Deadline: Before April 5th, 11:59 PM. - Please refer to the relevant chapters in the textbook for the required accounting formula. - Please refer to the knowledge gathered in Excel Project 1, consult with your friends and instructor or Google for Excel functions. - Complete your solution in this template and submit the electronic copy of your Excel worksheet in Canvas under the assignment link: ACC 2020 Excel Project 2 Spring 2020 by deadline. - Please name your file using your last name, first initial and the project name, for example, Siddiques_ACC2020_EP2.xlsx An assignment which is turned in late will have a 5% penalty per day. No assignments will be accepted one week after the due date without the prior approval of the instructor. You must submit your assignment in Canvas. Any assignment submitted in email will not be graded 1 Springfield Port Isabe! ASSUMPTIONS Product: Flexi suit Revenue per unit Total Variable costs of Goods Sold Total Fixed Costs of Goods Sold Total Variable Selling and Administration Expenses Total Fixed Selling and Administration Expenses Quarterly volume of units sold in the fourth quarter 2081 2 Projected Contribution Margin based Income Statement For Fourth quarter 2019 Springfield $ Port Isabel $ Answer check Sales Total Variable costs Contribution margin Total Fixed costs Net income 3 Variable Cost per unit Contribution Margin per unit Break Even units (use Roundup formula) Break Even sales Margin of Safety percentage Operating Leverage 4 Sensitivity Analyis Conservative scenario: Sales decrease by 50% than the projected sales Net Income under conservative scenario: Optimistic scenario: Sales increase by 50% than the projected sales Net Income under optimistic scenario: Explanation box: Do not hard code. Unk De appropriate cell in Project Description worksheet to get the data Budget Assumptions for Port Isabel Division Projected/Budgeted sales in unit for the fourth Quarter of 2011 The percentage of sales increase from one quarter to next quarter Desired Ending Inventory at the end of each quarter is 15% of the Budgeted sales unit of the same quarter Budgeted Ending inventory units for the fourth quarter of 2011 Completed, and from the data provided in the part in the Directions box in Project Description worksheet. These three are the only cells you are supposed to hard code. Sales Budget for the 2012 Ist quarter 2nd quarter 3rd quarter 4th quarter Total sale units Sales unit Answer choc Purchase Budget for the 20Y2 1st quarter 2nd quarter 3rd quarter 4th quarter Total sales Budgeted Sales unit Plus Desired Ending Inventory Equal to Total need Less Beginning inventory Equal to Budgeted Purchase Answer chec Do not hard code. Link the appropriate col in Project Description worksheet to get the data Budget Assumptions for Port Isabel Division Projected/Budgeted sales in unit for the fourth Quarter of 2011 The percentage of sales increase from one quarter to next quarter Desired Ending Inventory at the end of each quarter is 15% of the Budgeted sales unit of the same quarter Budgeted Ending inventory units for the fourth quarter of 2041 Complete el 3, B4 and B6 from the data provided in the Part B in the Directions box in Project Description worksheet. These three are the only cells you are supposed to hard code. Sales Budget for the 2012 Ist quarter 2nd quarter 3rd quarter 4th quarter Total sale units Sales unit Answer check Purchase Budget for the 2012 Ist quarter 2nd quarter 3rd quarter 4th quarter Total sales Budgeted Sales unit Plus Desired Ending Inventory Equal to Total need Less Beginning inventory Equal to Budgeted Purchase Answer check
Step by Step Solution
There are 3 Steps involved in it

Get step-by-step solutions from verified subject matter experts