

Question: All information is provided to answer question completely. EXHIBIT 1 Apple Sales, 2015-2018 (dollars in millions and units in thousands) EXHIBIT 2 Apple Product Performance-Percentage
All information is provided to answer question completely.
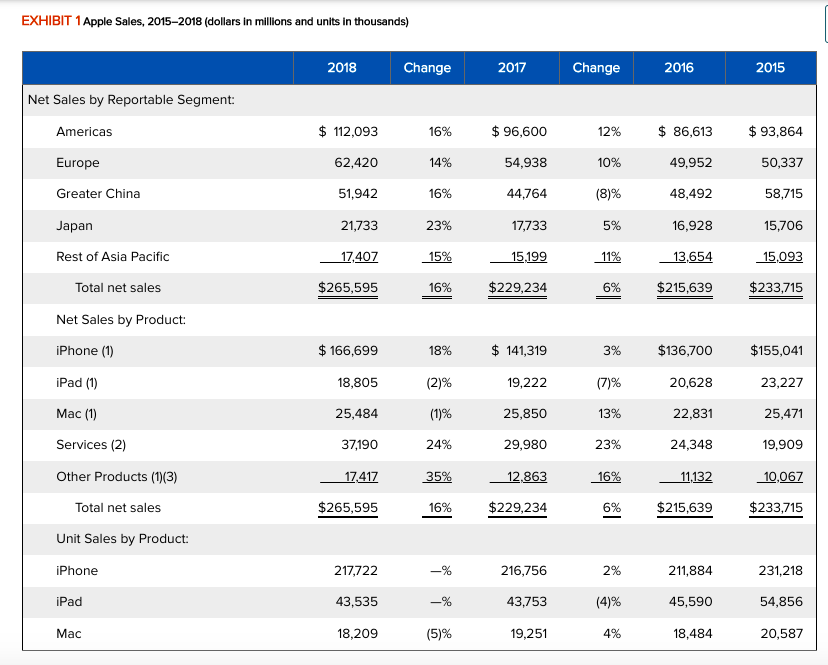
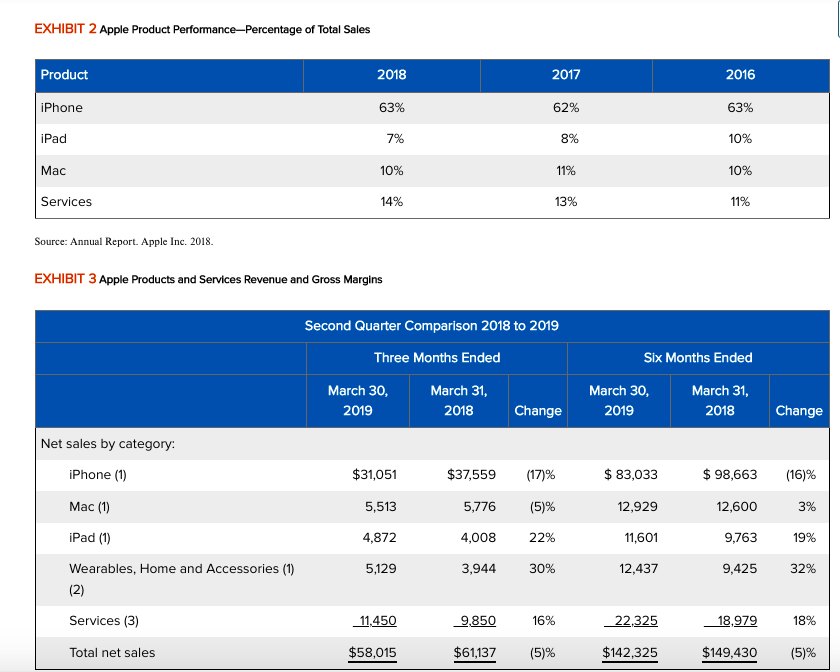
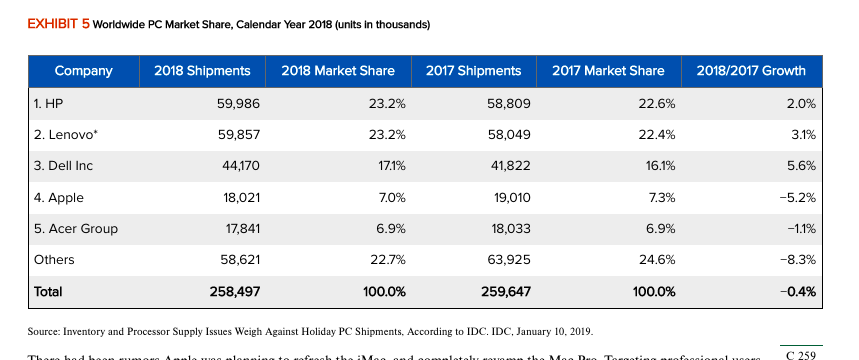
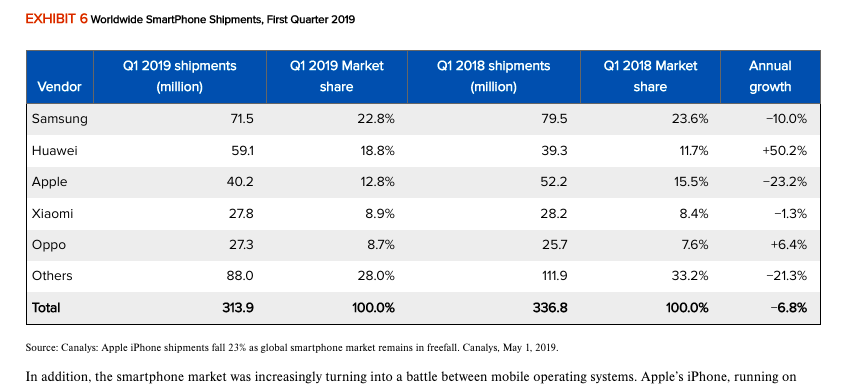
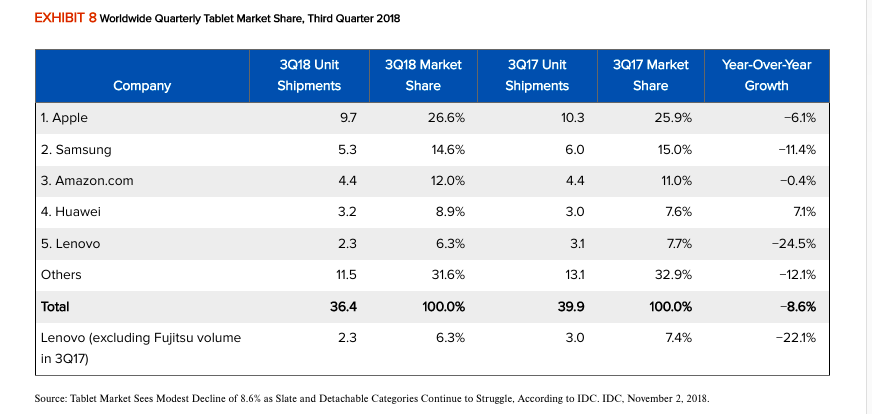
EXHIBIT 1 Apple Sales, 2015-2018 (dollars in millions and units in thousands) EXHIBIT 2 Apple Product Performance-Percentage of Total Sales Source: Annual Report. Apple Inc. 2018. EXHIBIT 3 Apple Products and Services Revenue and Gross Margins EXHIBIT 5 Worldwide PC Market Share, Calendar Year 2018 (units in thousands) Source: Inventory and Processor Supply Issues Weigh Against Holiday PC Shipments, According to IDC. IDC, January 10, 2019. EXHIBIT 6 Worldwide SmartPhone Shipments, First Quarter 2019 Source: Canalys: Apple iPhone shipments fall 23% as global smartphone market remains in freefall. Canalys, May 1, 2019. In addition, the smartphone market was increasingly turning into a battle between mobile operating systems. Apple's iPhone, running on EXHIBIT 8 Worldwide Quarterly Tablet Market Share, Third Quarter 2018 Financial Analysis: Apple Inc. The following questions are about key financial ratios that impart useful insights into the financlal health of Apple. The financial ratios offer quantitative measurements of the success or failure of Apple's strategies. Part 1: Key Financial Ratios Using available data in the case, calculate the requested financial ratios for the years 2016,2017 , and 2018. Round up all numbers to the nearest hundredth. For example, answers should look like -0.05 or 1.33. Note: R\&D and total expense (operating) figures are taken from Morningstar Inc. Required Information Financial Analysis: Apple Inc. The following questions are about key financial ratios that impart useful insights into the financlal health of Apple. The financlal ratios offer quantitative measurements of the success or fallure of Apple's strategies. Part 2: Annual Growth Activity Exhlbit 1 in the case provides sales information on Apple for the years 2016 through 2018 . For each item listed below, calculate the percentage rate of annual growth (or decline) from 2016 to 2017 and from 2017 to 2018 . All calculations should be rounded to one decimal (e.g., 12.7\%) Note: Financial info that is not in the case is taken from Morningstar Inc
Step by Step Solution
There are 3 Steps involved in it

Get step-by-step solutions from verified subject matter experts