

Question: all Jou u se A or 6 (60 points) H US of any of the three assets (stock A, stock B and the polltolio would
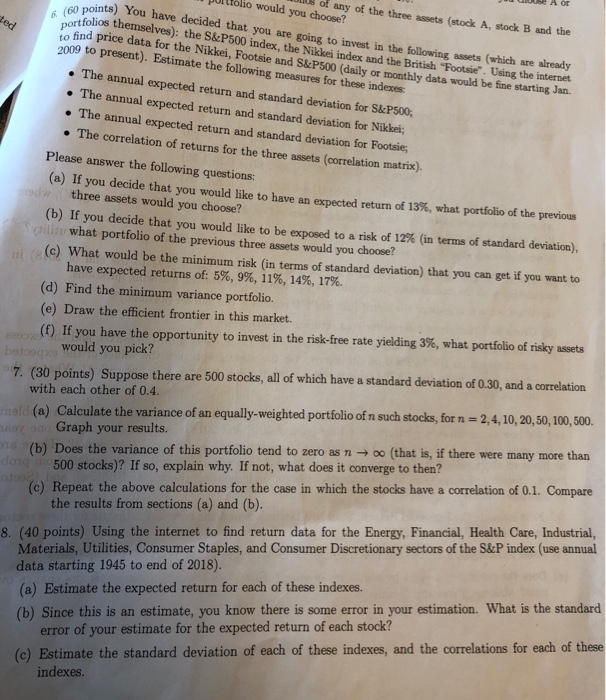
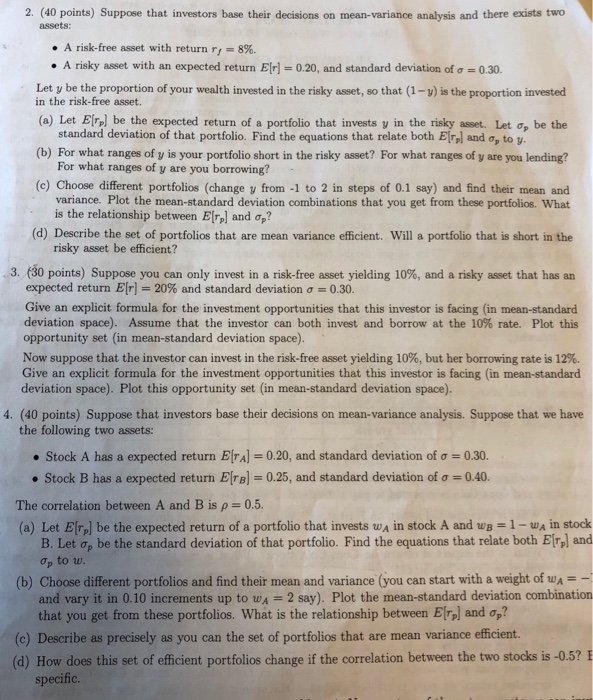
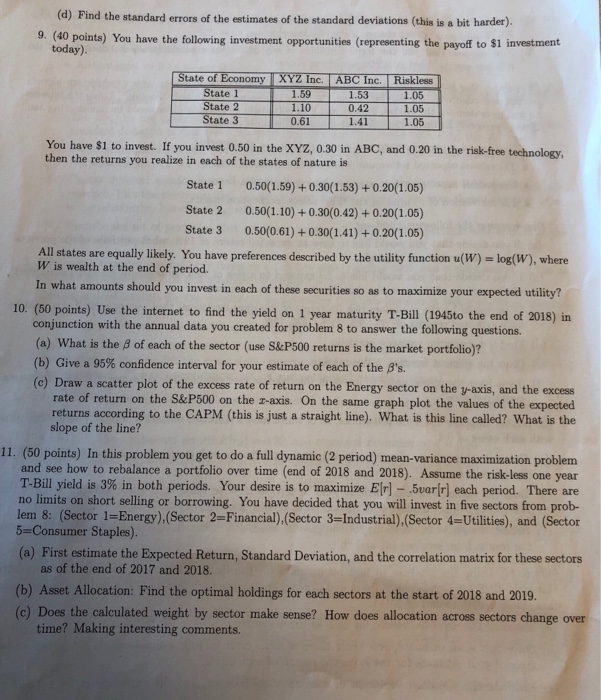
Jou u se A or 6 (60 points) H US of any of the three assets (stock A, stock B and the polltolio would you choose? e points) You have decided that you are going to invest in the following assets which are already folijos themselves): the S&P500 index, the Nikkei index and the British Footsie Uhingen to find price data for the Nikkel, Footsie and S&P500 (daily or monthly data would be fine starting Jan. 2009 to present). Estimate the following measures for these indexes: ded The annual expected return and standard deviation for S&P500: The annual expected return and standard deviation for Nikkei; The annual expected return and standard deviation for Footsie, The correlation of returns for the three assets (correlation matrix). Please answer the following questions: (a) if you decide that you would like to have an expected return of 13%, what portfolio of the previous w three assets would you choose? (b) If you decide that you would like to be exposed to a risk of 12% (in terms of standard deviation), what portfolio of the previous three assets would you choose? (c) What would be the minimum risk in terms of standard deviation) that you can get if you want to have expected returns of: 5%, 9%, 11%, 14%, 17%. (d) Find the minimum variance portfolio. (e) Draw the efficient frontier in this market. (f) If you have the opportunity to invest in the risk-free rate yielding 3%, what portfolio of risky assets betoog would you pick? 7. (30 points) Suppose there are 500 stocks, all of which have a standard deviation of 0.30, and a correlation with each other of 0.4. mold (a) Calculate the variance of an equally-weighted portfolio of n such stocks, for n = 2,4, 10, 20, 50, 100, 500 TROY og Graph your results. (b) Does the variance of this portfolio tend to zero as n 0 (that is, if there were many more than do 500 stocks)? If so, explain why. If not, what does it converge to then? (c) Repeat the above calculations for the case in which the stocks have a correlation of 0.1. Compare the results from sections (a) and (b). 8. (40 points) Using the internet to find return data for the Energy, Financial, Health Care, Industrial, Materials, Utilities, Consumer Staples, and Consumer Discretionary sectors of the S&P index (use annual data starting 1945 to end of 2018). (a) Estimate the expected return for each of these indexes. (b) Since this is an estimate, you know there is some error in your estimation. What is the standard error of your estimate for the expected return of each stock? (c) Estimate the standard deviation of each of these indexes, and the correlations for each of these indexes. 2. (40 points) Suppose that investors base their decisions on mean-variance analysis and there exists two assets: A risk-free asset with return , 8%. A risky asset with an expected return E[r] =0.20, and standard deviation of a = 0.30. Let y be the proportion of your wealth invested in the risky asset, so that (1-v) is the proportion invested in the risk-free asset. (a) Let Elr) be the expected return of a portfolio that invests y in the risky asset. Let o, be the standard deviation of that portfolio. Find the equations that relate both E[r) and o, to y. (b) For what ranges of y is your portfolio short in the risky asset? For what ranges of y are you lending? For what ranges of y are you borrowing? (c) Choose different portfolios (change y from -1 to 2 in steps of 0.1 say) and find their mean and variance. Plot the mean-standard deviation combinations that you get from these portfolios. What is the relationship between E[rel and op? (d) Describe the set of portfolios that are mean variance efficient. Will a portfolio that is short in the risky asset be efficient? 3. (30 points) Suppose you can only invest in a risk-free asset yielding 10%, and a risky asset that has an expected return Elr] =20% and standard deviation o = 0.30. Give an explicit formula for the investment opportunities that this investor is facing (in mean-standard deviation space). Assume that the investor can both invest and borrow at the 10% rate. Plot this opportunity set (in mean-standard deviation space) Now suppose that the investor can invest in the risk-free asset yielding 10%, but her borrowing rate is 12%. Give an explicit formula for the investment opportunities that this investor is facing (in mean-standard deviation space). Plot this opportunity set in mean-standard deviation space). 4. (40 points) Suppose that investors base their decisions on mean-variance analysis. Suppose that we have the following two assets: Stock A has a expected return E[TA] = 0.20, and standard deviation of o = 0.30. Stock B has a expected return EITB] = 0.25, and standard deviation of o=0.40. The correlation between A and B is p=0.5. (a) Let Er be the expected return of a portfolio that invests w in stock A and ws=1 - WA in stock B. Let o be the standard deviation of that portfolio. Find the equations that relate both Erol and Op to w. (b) Choose different portfolios and find their mean and variance (you can start with a weight of WA and vary it in 0.10 increments up to wa = 2 say). Plot the mean-standard deviation combination that you get from these portfolios. What is the relationship between Ero) and on? (C) Describe as precisely as you can the set of portfolios that are mean variance efficient. (d) How does this set of efficient portfolios change if the correlation between the two stocks is -0.5? E specific (d) Find the standard errors of the estimates of the standard deviations (this is a bit harder). 9. (40 points) You have the following investment opportunities (representing the payoff to $1 investment today) State of Economy XYZ Inc. ABC Inc. Riskless State 1 1 .59 1 1.53 1.05 State 2 1 .10 0.42 1.05 State 3 0.61 1.41 1.05 You have $1 to invest. If you invest 0.50 in the XYZ, 0.30 in ABC, and 0.20 in the risk-free technology, then the returns you realize in each of the states of nature is State 1 0.50(1.59) + 0.30(1.53) + 0.20(1.05) State 2 0.50(1.10) + 0.30(0.42) + 0.20(1.05) State 3 0 .50(0.61) + 0.30(1.41) + 0.20(1.05) All states are equally likely. You have preferences described by the utility function (W) = log(W), where W is wealth at the end of period. In what amounts should you invest in each of these securities so as to maximize your expected utility? 10. (50 points) Use the internet to find the yield on 1 year maturity T-Bill (1945to the end of 2018) in conjunction with the annual data you created for problem 8 to answer the following questions. (a) What is the 8 of each of the sector (use S&P500 returns is the market portfolio)? (b) Give a 95% confidence interval for your estimate of each of the B's. (c) Draw a scatter plot of the excess rate of return on the Energy sector on the y-axis, and the excess rate of return on the S&P500 on the z-axis. On the same graph plot the values of the expected returns according to the CAPM (this is just a straight line). What is this line called? What is the slope of the line? 11. (50 points) In this problem you get to do a full dynamic (2 period) mean-variance maximization problem and see how to rebalance a portfolio over time (end of 2018 and 2018). Assume the risk-less one year T-Bill yield is 3% in both periods. Your desire is to maximize E[r] - Suar(r) each period. There are no limits on short selling or borrowing. You have decided that you will invest in five sectors from prob- lem 8: (Sector 1=Energy),(Sector 2=Financial) (Sector 3=Industrial) (Sector 4=Utilities), and (Sector 5=Consumer Staples). (a) First estimate the Expected Return, Standard Deviation, and the correlation matrix for these sectors as of the end of 2017 and 2018. (b) Asset Allocation: Find the optimal holdings for each sectors at the start of 2018 and 2019. (c) Does the calculated weight by sector make sense? How does allocation across sectors change over time? Making interesting comments. Jou u se A or 6 (60 points) H US of any of the three assets (stock A, stock B and the polltolio would you choose? e points) You have decided that you are going to invest in the following assets which are already folijos themselves): the S&P500 index, the Nikkei index and the British Footsie Uhingen to find price data for the Nikkel, Footsie and S&P500 (daily or monthly data would be fine starting Jan. 2009 to present). Estimate the following measures for these indexes: ded The annual expected return and standard deviation for S&P500: The annual expected return and standard deviation for Nikkei; The annual expected return and standard deviation for Footsie, The correlation of returns for the three assets (correlation matrix). Please answer the following questions: (a) if you decide that you would like to have an expected return of 13%, what portfolio of the previous w three assets would you choose? (b) If you decide that you would like to be exposed to a risk of 12% (in terms of standard deviation), what portfolio of the previous three assets would you choose? (c) What would be the minimum risk in terms of standard deviation) that you can get if you want to have expected returns of: 5%, 9%, 11%, 14%, 17%. (d) Find the minimum variance portfolio. (e) Draw the efficient frontier in this market. (f) If you have the opportunity to invest in the risk-free rate yielding 3%, what portfolio of risky assets betoog would you pick? 7. (30 points) Suppose there are 500 stocks, all of which have a standard deviation of 0.30, and a correlation with each other of 0.4. mold (a) Calculate the variance of an equally-weighted portfolio of n such stocks, for n = 2,4, 10, 20, 50, 100, 500 TROY og Graph your results. (b) Does the variance of this portfolio tend to zero as n 0 (that is, if there were many more than do 500 stocks)? If so, explain why. If not, what does it converge to then? (c) Repeat the above calculations for the case in which the stocks have a correlation of 0.1. Compare the results from sections (a) and (b). 8. (40 points) Using the internet to find return data for the Energy, Financial, Health Care, Industrial, Materials, Utilities, Consumer Staples, and Consumer Discretionary sectors of the S&P index (use annual data starting 1945 to end of 2018). (a) Estimate the expected return for each of these indexes. (b) Since this is an estimate, you know there is some error in your estimation. What is the standard error of your estimate for the expected return of each stock? (c) Estimate the standard deviation of each of these indexes, and the correlations for each of these indexes. 2. (40 points) Suppose that investors base their decisions on mean-variance analysis and there exists two assets: A risk-free asset with return , 8%. A risky asset with an expected return E[r] =0.20, and standard deviation of a = 0.30. Let y be the proportion of your wealth invested in the risky asset, so that (1-v) is the proportion invested in the risk-free asset. (a) Let Elr) be the expected return of a portfolio that invests y in the risky asset. Let o, be the standard deviation of that portfolio. Find the equations that relate both E[r) and o, to y. (b) For what ranges of y is your portfolio short in the risky asset? For what ranges of y are you lending? For what ranges of y are you borrowing? (c) Choose different portfolios (change y from -1 to 2 in steps of 0.1 say) and find their mean and variance. Plot the mean-standard deviation combinations that you get from these portfolios. What is the relationship between E[rel and op? (d) Describe the set of portfolios that are mean variance efficient. Will a portfolio that is short in the risky asset be efficient? 3. (30 points) Suppose you can only invest in a risk-free asset yielding 10%, and a risky asset that has an expected return Elr] =20% and standard deviation o = 0.30. Give an explicit formula for the investment opportunities that this investor is facing (in mean-standard deviation space). Assume that the investor can both invest and borrow at the 10% rate. Plot this opportunity set (in mean-standard deviation space) Now suppose that the investor can invest in the risk-free asset yielding 10%, but her borrowing rate is 12%. Give an explicit formula for the investment opportunities that this investor is facing (in mean-standard deviation space). Plot this opportunity set in mean-standard deviation space). 4. (40 points) Suppose that investors base their decisions on mean-variance analysis. Suppose that we have the following two assets: Stock A has a expected return E[TA] = 0.20, and standard deviation of o = 0.30. Stock B has a expected return EITB] = 0.25, and standard deviation of o=0.40. The correlation between A and B is p=0.5. (a) Let Er be the expected return of a portfolio that invests w in stock A and ws=1 - WA in stock B. Let o be the standard deviation of that portfolio. Find the equations that relate both Erol and Op to w. (b) Choose different portfolios and find their mean and variance (you can start with a weight of WA and vary it in 0.10 increments up to wa = 2 say). Plot the mean-standard deviation combination that you get from these portfolios. What is the relationship between Ero) and on? (C) Describe as precisely as you can the set of portfolios that are mean variance efficient. (d) How does this set of efficient portfolios change if the correlation between the two stocks is -0.5? E specific (d) Find the standard errors of the estimates of the standard deviations (this is a bit harder). 9. (40 points) You have the following investment opportunities (representing the payoff to $1 investment today) State of Economy XYZ Inc. ABC Inc. Riskless State 1 1 .59 1 1.53 1.05 State 2 1 .10 0.42 1.05 State 3 0.61 1.41 1.05 You have $1 to invest. If you invest 0.50 in the XYZ, 0.30 in ABC, and 0.20 in the risk-free technology, then the returns you realize in each of the states of nature is State 1 0.50(1.59) + 0.30(1.53) + 0.20(1.05) State 2 0.50(1.10) + 0.30(0.42) + 0.20(1.05) State 3 0 .50(0.61) + 0.30(1.41) + 0.20(1.05) All states are equally likely. You have preferences described by the utility function (W) = log(W), where W is wealth at the end of period. In what amounts should you invest in each of these securities so as to maximize your expected utility? 10. (50 points) Use the internet to find the yield on 1 year maturity T-Bill (1945to the end of 2018) in conjunction with the annual data you created for problem 8 to answer the following questions. (a) What is the 8 of each of the sector (use S&P500 returns is the market portfolio)? (b) Give a 95% confidence interval for your estimate of each of the B's. (c) Draw a scatter plot of the excess rate of return on the Energy sector on the y-axis, and the excess rate of return on the S&P500 on the z-axis. On the same graph plot the values of the expected returns according to the CAPM (this is just a straight line). What is this line called? What is the slope of the line? 11. (50 points) In this problem you get to do a full dynamic (2 period) mean-variance maximization problem and see how to rebalance a portfolio over time (end of 2018 and 2018). Assume the risk-less one year T-Bill yield is 3% in both periods. Your desire is to maximize E[r] - Suar(r) each period. There are no limits on short selling or borrowing. You have decided that you will invest in five sectors from prob- lem 8: (Sector 1=Energy),(Sector 2=Financial) (Sector 3=Industrial) (Sector 4=Utilities), and (Sector 5=Consumer Staples). (a) First estimate the Expected Return, Standard Deviation, and the correlation matrix for these sectors as of the end of 2017 and 2018. (b) Asset Allocation: Find the optimal holdings for each sectors at the start of 2018 and 2019. (c) Does the calculated weight by sector make sense? How does allocation across sectors change over time? Making interesting comments
Step by Step Solution
There are 3 Steps involved in it

Get step-by-step solutions from verified subject matter experts