

Question: all one question QUESTION #2: (8 marks) To assess the weight control of a 16-ounce (oz.) packaged product, the net weight of the product is
all one question
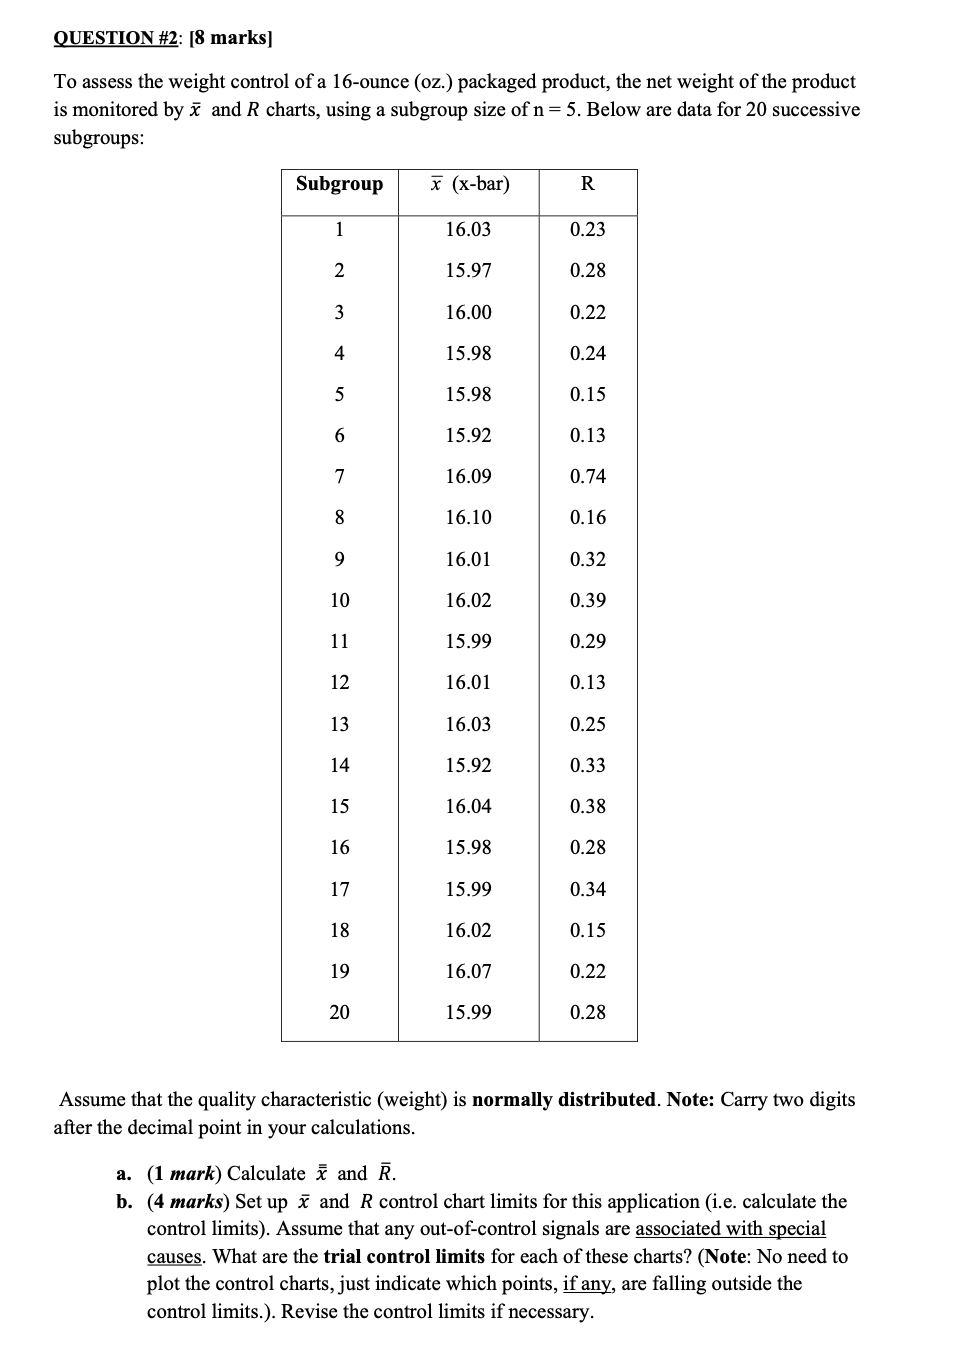
QUESTION #2: (8 marks) To assess the weight control of a 16-ounce (oz.) packaged product, the net weight of the product is monitored by and R charts, using a subgroup size of n = 5. Below are data for 20 successive subgroups: Subgroup x (x-bar) R 1 16.03 0.23 2 15.97 0.28 3 16.00 0.22 4 15.98 0.24 5 15.98 0.15 6 15.92 0.13 7 16.09 0.74 8 16.10 0.16 9 16.01 0.32 10 16.02 0.39 11 15.99 0.29 12 16.01 0.13 13 16.03 0.25 14 15.92 0.33 15 16.04 0.38 16 15.98 0.28 17 15.99 0.34 18 16.02 0.15 19 16.07 0.22 20 15.99 0.28 Assume that the quality characteristic (weight) is normally distributed. Note: Carry two digits after the decimal point in your calculations. a. (1 mark) Calculate and R. b. (4 marks) Set up 7 and R control chart limits for this application (i.e. calculate the control limits). Assume that any out-of-control signals are associated with special causes. What are the trial control limits for each of these charts? (Note: No need to plot the control charts, just indicate which points, if any, are falling outside the control limits.). Revise the control limits if necessary. c. (1 mark) Estimate the (unknown) mean (u) and (unknown) standard deviation (o) of the process generating the individual measurements. d. (2 marks) Based on your estimates in part (c), estimate the proportion of packages not conforming to specifications of 16 0.25 (i.e. USL = 16.25 and LSL = 15.75). Hint: Use the normal distribution and the normal curve areas to compute this percentageStep by Step Solution
There are 3 Steps involved in it
1 Expert Approved Answer
Step: 1 Unlock

Question Has Been Solved by an Expert!
Get step-by-step solutions from verified subject matter experts
Step: 2 Unlock
Step: 3 Unlock