

Question: All question Step by stepThanks Problem 1 Problem 3 Problem 6 In a large college, 85% of students are fluent in two or more The
All question Step by stepThanks

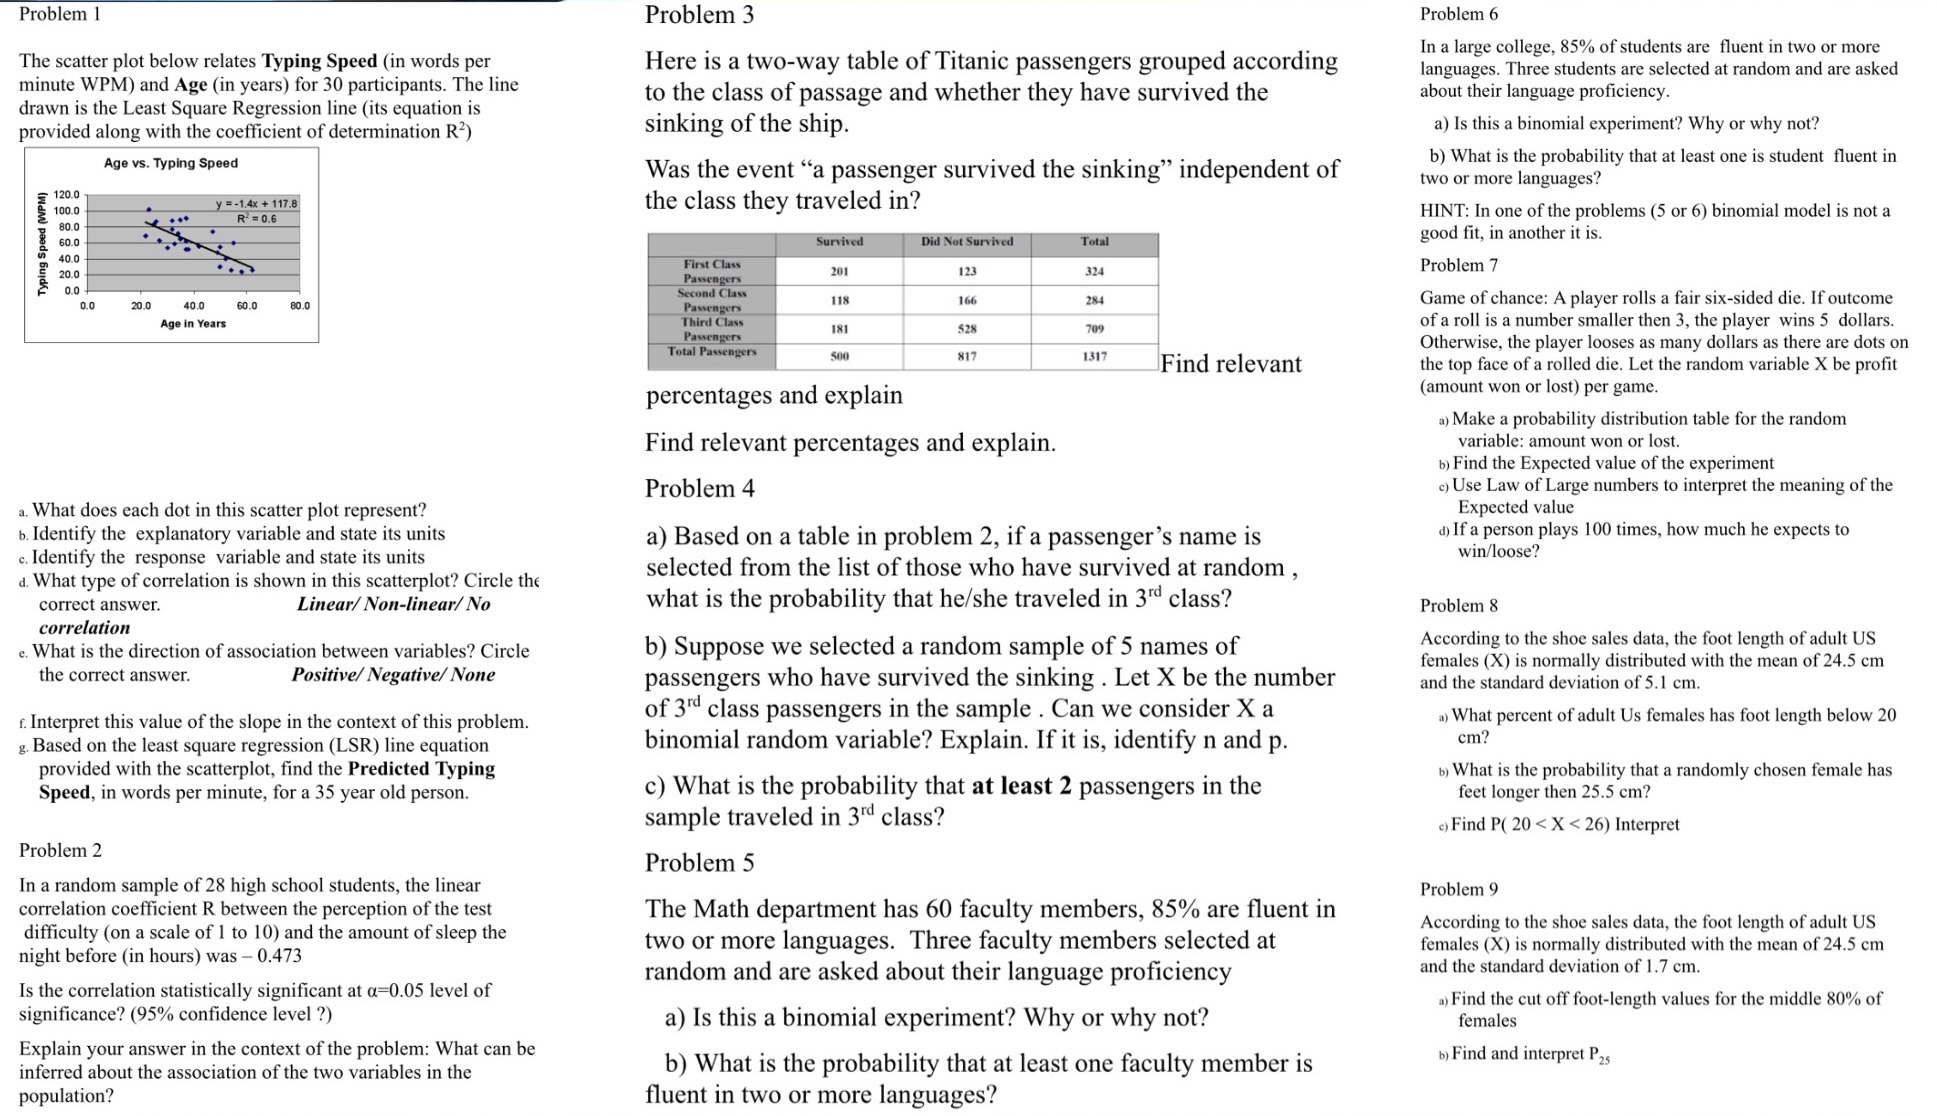
Problem 1 Problem 3 Problem 6 In a large college, 85% of students are fluent in two or more The scatter plot below relates Typing Speed (in words per Here is a two-way table of Titanic passengers grouped according languages. Three students are selected at random and are asked minute WPM) and Age (in years) for 30 participants. The line about their language proficiency. drawn is the Least Square Regression line (its equation is to the class of passage and whether they have survived the provided along with the coefficient of determination R) sinking of the ship. a) Is this a binomial experiment? Why or why not? Age vs. Typing Speed Was the event "a passenger survived the sinking" independent of b) What is the probability that at least one is student fluent in two or more languages? 120.0 100.0 y = -1.4x + 117.8 the class they traveled in? HINT: In one of the problems (5 or 6) binomial model is not a 80.0 R' = 0.6 60.0 Survived Did Not Survived Total good fit, in another it is. 20 0 . . . First Class Passengers 201 123 324 Problem 7 Second Class 0. 20.0 40.0 60.0 80.0 Passengers 118 166 284 Game of chance: A player rolls a fair six-sided die. If outcome Age in Years Third Class 181 528 709 of a roll is a number smaller then 3, the player wins 5 dollars. Passengers Total Passengers 500 817 1317 Otherwise, the player looses as many dollars as there are dots on Find relevant the top face of a rolled die. Let the random variable X be profit percentages and explain (amount won or lost) per game. ) Make a probability distribution table for the random Find relevant percentages and explain. variable: amount won or lost. b) Find the Expected value of the experiment Problem 4 c) Use Law of Large numbers to interpret the meaning of the a. What does each dot in this scatter plot represent? Expected value b. Identify the explanatory variable and state its units a) Based on a table in problem 2, if a passenger's name is d) If a person plays 100 times, how much he expects to c. Identify the response variable and state its units win/loose? . What type of correlation is shown in this scatterplot? Circle the selected from the list of those who have survived at random , correct answer. Linear/ Non-linear/ No what is the probability that he/she traveled in 3"d class? Problem 8 correlation . What is the direction of association between variables? Circle b) Suppose we selected a random sample of 5 names of According to the shoe sales data, the foot length of adult US females (X) is normally distributed with the mean of 24.5 cm the correct answer. Positive/ Negative/ None passengers who have survived the sinking . Let X be the number and the standard deviation of 5.1 cm. f. Interpret this value of the slope in the context of this problem. of 3"d class passengers in the sample . Can we consider X a ) What percent of adult Us females has foot length below 20 g. Based on the least square regression (LSR) line equation binomial random variable? Explain. If it is, identify n and p. cm? provided with the scatterplot, find the Predicted Typing b) What is the probability that a randomly chosen female has Speed, in words per minute, for a 35 year old person. c) What is the probability that at least 2 passengers in the feet longer then 25.5 cm? sample traveled in 3"d class? Find P( 20
Step by Step Solution
There are 3 Steps involved in it

Get step-by-step solutions from verified subject matter experts