

Question: all questions please with format E F G H J K L N o P Q 1 3 4. 5 M Given below are annual
all questions please with format
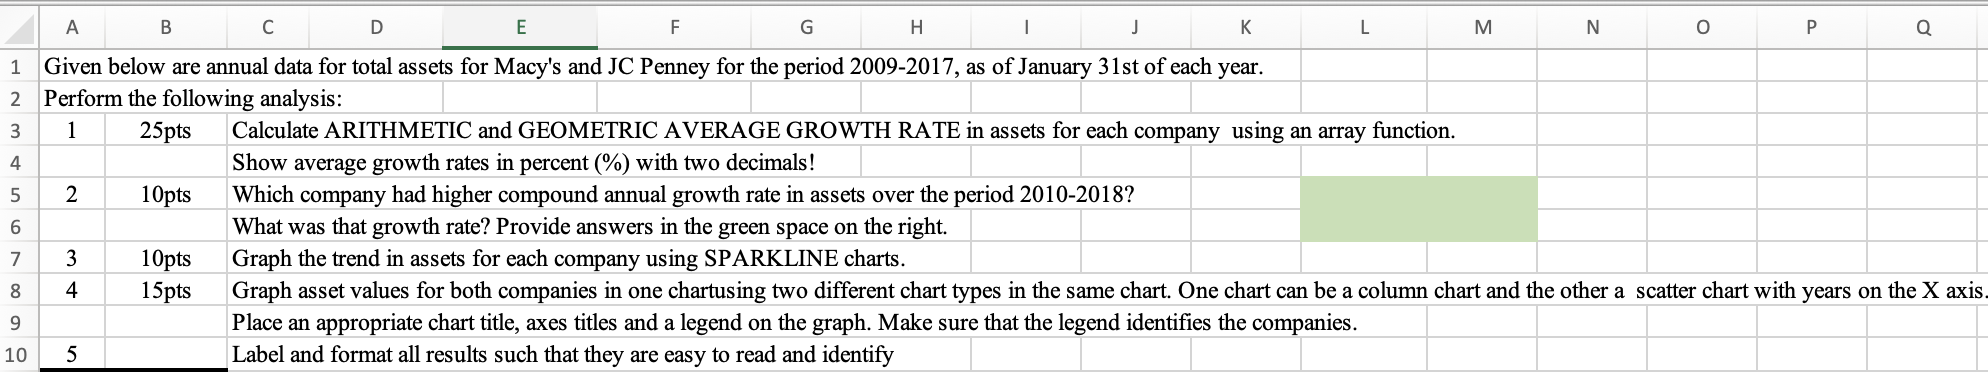
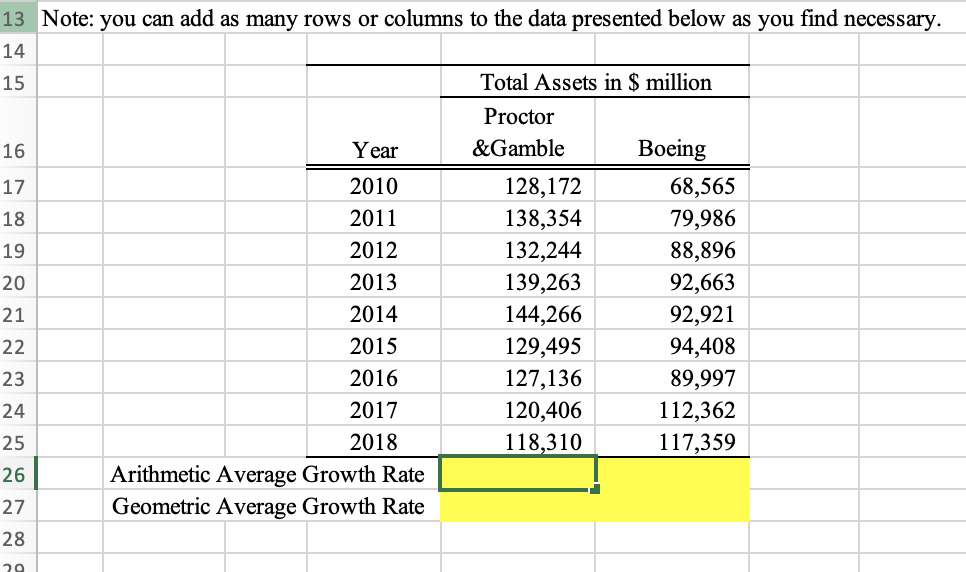
E F G H J K L N o P Q 1 3 4. 5 M Given below are annual data for total assets for Macy's and JC Penney for the period 2009-2017, as of January 31st of each year. 2 Perform the following analysis: 1 25pts Calculate ARITHMETIC and GEOMETRIC AVERAGE GROWTH RATE in assets for each company using an array function. Show average growth rates in percent (%) with two decimals! 2 10pts Which company had higher compound annual growth rate in assets over the period 2010-2018? 6 What was that growth rate? Provide answers in the green space on the right. 3 10pts Graph the trend in assets for each company using SPARKLINE charts. 4 15pts Graph asset values for both companies in one chartusing two different chart types in the same chart. One chart can be a column chart and the other a scatter chart with years on the X axis. Place an appropriate chart title, axes titles and a legend on the graph. Make sure that the legend identifies the companies. 5 Label and format all results such that they are easy to read and identify 7 009 Year 13 Note: you can add as many rows or columns to the data presented below as you find necessary. 14 15 Total Assets in $ million Proctor 16 &Gamble Boeing 17 2010 128,172 68,565 18 2011 138,354 79,986 19 2012 132,244 88,896 20 2013 139,263 92,663 21 2014 144,266 92,921 22 2015 129,495 94,408 23 2016 127,136 89,997 24 2017 120,406 112,362 25 2018 118,310 117,359 26 Arithmetic Average Growth Rate 27 Geometric Average Growth Rate 28 20
Step by Step Solution
There are 3 Steps involved in it

Get step-by-step solutions from verified subject matter experts