

Question: All ratios must be computed using the ratios listed in the Appendix: Financial Ratio Formula Sheet. Show all workings. (a) Compute the following for the
All ratios must be computed using the ratios listed in the Appendix: Financial Ratio Formula Sheet. Show all workings. (a) Compute the following for the company: (i) The current ratio. (ii) Days sales in inventory. (iii) Days sales uncollected. (iv) Days' purchases in accounts payable. (8 marks) (b) Use the ratios from (a) to report on the short term credit risk of the company compared to the industry average. (5 marks) (c) Compute the following for the company: (i) Time interest earned. (ii) Equity ratio. (d) Analyse and comment on the ratios computed in (c). 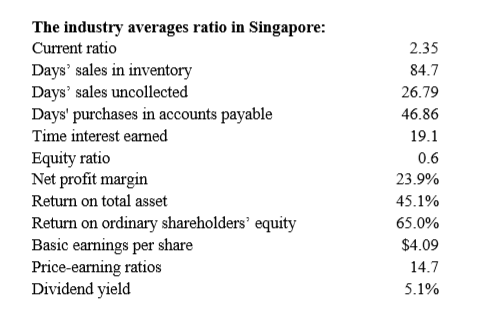
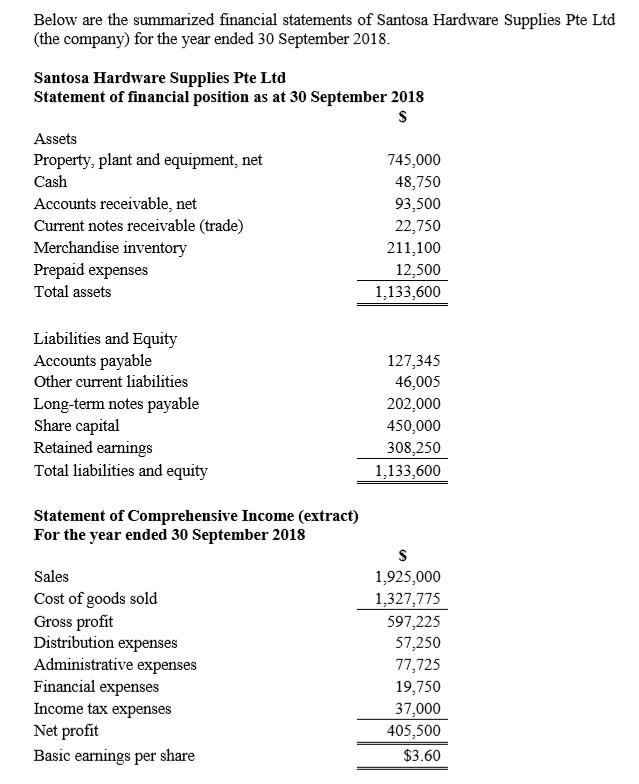
The industry averages ratio in Singapore: Current ratio Days' sales in inventory Days' sales uncollected Days' purchases in accounts payable Time interest earned Equity ratio Net profit margin Return on total asset Return on ordinary shareholders' equity Basic earnings per share Price-earning ratios Dividend yield 2.35 84.7 26.79 46.86 19.1 0.6 23.9% 45.1% 65.0% $4.09 14.7 5.1% Below are the summarized financial statements of Santosa Hardware Supplies Pte Ltd (the company) for the year ended 30 September 2018. Santosa Hardware Supplies Pte Ltd Statement of financial position as at 30 September 2018 $ Assets Property, plant and equipment, net 745,000 Cash 48,750 Accounts receivable, net 93,500 Current notes receivable (trade) 22,750 Merchandise inventory 211,100 Prepaid expenses 12,500 Total assets 1,133,600 Liabilities and Equity Accounts payable Other current liabilities Long-term notes payable Share capital Retained earnings Total liabilities and equity 127,345 46,005 202,000 450,000 308,250 1,133,600 Statement of Comprehensive Income (extract) For the year ended 30 September 2018 Sales Cost of goods sold Gross profit Distribution expenses Administrative expenses Financial expenses Income tax expenses Net profit Basic earnings per share $ 1,925,000 1,327,775 597,225 57,250 77,725 19,750 37,000 405,500 $3.60
Step by Step Solution
There are 3 Steps involved in it

Get step-by-step solutions from verified subject matter experts