

Question: All solutions will be made for every sector.(Right click on the image and open it on another tab if it is too small) Yurt ii
All solutions will be made for every sector.(Right click on the image and open it on another tab if it is too small)
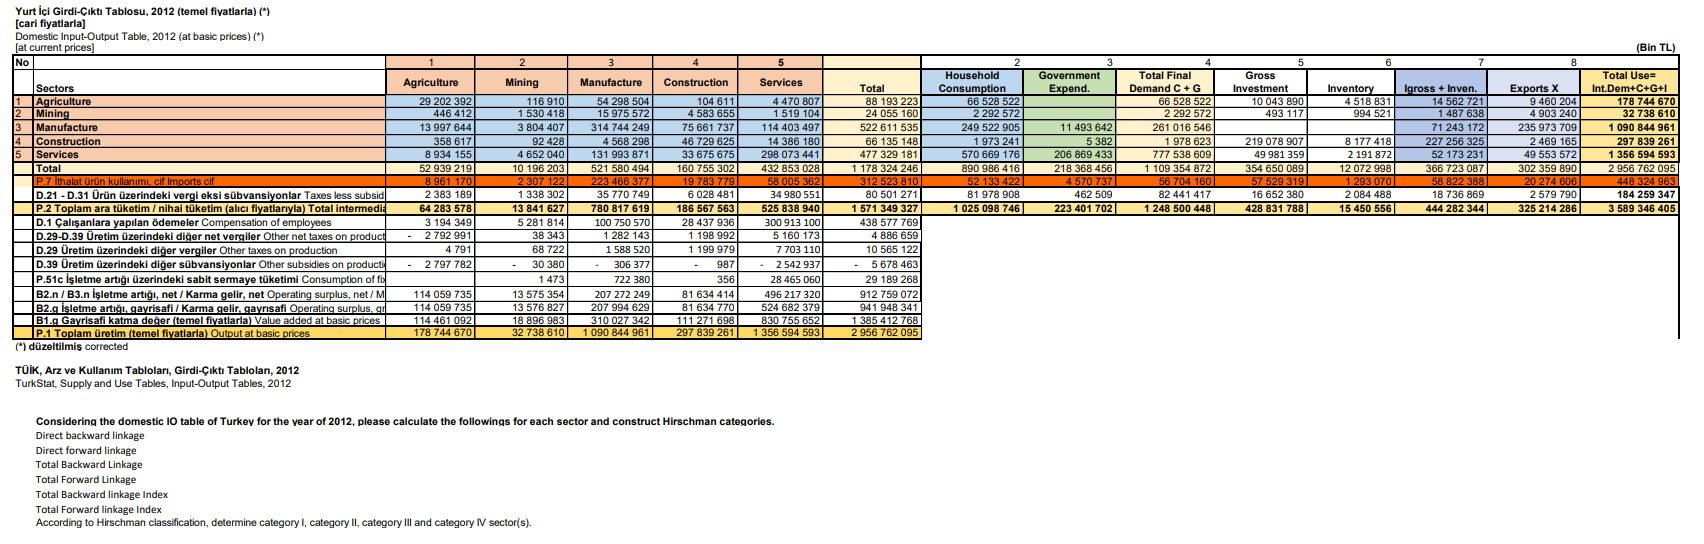
Yurt ii Girdi-kt Tablosu, 2012 (temel fiyatlarla) () [cari fiyatlarla Domestic Input-Output Table, 2012 (at basic prices) (*) [at current prices INo (Bin TL) 2 3 4 5 6 7 8 Manufacture Construction Government Expend. 5 Gross Investment 10 043 890 Inventory 4 518 831 994 521 493 117 Agriculture 29 202 392 446 412 13 997 644 358 617 8 934 155 52 939 219 8 961 170 2 383 189 64 283 578 3 194 349 2 792 991 4791 2 797 782 Mining 116 910 1530 418 3 804 407 92 428 4 652 040 10 196 203 2 307 122 1 338 302 13 841 627 5 281 814 38 343 68 722 30 380 1 473 13 575 354 13 576 827 18 896 983 32 738 610 2 Household Consumption 66 528 522 2 292 572 249 522 905 1 973 241 570 669 176 890 986 416 52 133 4221 81 978 908 1 025 098 746 Services 4 470 807 1 519 104 114 403 497 14 386 180 298 073 441 432 853 028 58 005 362 34 980 551 525 838 940 300 913 100 5 160 173 7 703 110 2 542 937 28 465 060 496 217 320 524 682 379 830 755 652 1 356 594 593 11 493 642 5 382 206 869 433 218 368 456 4 570 737 462 509 223 401 702 4 Total Final Demand C + G 66 528 522 2 292 572 261 016 546 1 978 623 777 538 609 1109 354 872 56 704 1601 82 441 417 1 248 500 448 Total 88 193 223 24 055 160 522 611 535 66 135 148 477 329 181 1 178 324 246 312 523 8101 80 501 271 1 571 349 327 438 577 769 4 886 659 10 565 122 5 678 463 29 189 268 912 759 072 941 948 341 1 385 412 768 2 956 762 095 219 078 907 49 981 359 354 650 089 57 529 319 16 652 380 428 831 788 Sectors 1 Agriculture 2 Mining 3 Manufacture 4 Construction 5 Services Total P.7 thalat rn kullanimi, cif Imports cif D.21 - D.31 rn zerindeki vergi eksi sbvansiyonlar Taxes less subsid P.2 Toplam ara tketim / nihai tketim alc fiyatlaryla) Total intermedi: D.1 alanlara yaplan demeler Compensation of employees D.29-D.39 retim zerindeki dier net vergiler Other net taxes on product D.29 retim zerindeki dier vergiler Other taxes on production D.39 retim zerindeki dier sbvansiyonlar Other subsidies on product P.51c iletme artii zerindeki sabit sermaye tketimi Consumption off B2.n/B3.n letme art, net / Karma gelir, net Operating surplus, net/M B2.q isletme art, gayrisafi / Karma gelir, gayrisafi Operating surplus.gr B1.9 Gayrisafi katma deer temel fiyatlarla Value added at basic prices P.1 Toplam retim temel fiyatlarla) Output at basic prices (*) dzeltilmis corrected 8 177 418 2 191 872 12 072 998 1 293 070 2 084 488 15 450 556 Igross + Inven. 14 562 721 1 487 638 71 243 172 227 256 325 52 173 231 366 723 0871 58 822 388 18 736 869 444 282 3441 Exports X 9 460 204 4 903 240 235 973 709 2469 165 49 553 572 302 359 890 20 274 606 2 579 790 325 214 286 Total User Int.Dem+C+G+1 178 744 670 32 738 610 1 090 844 961 297 839 261 1 356 594 593 2 956 762 095 448 324 963 184 259 347 3 589 346 405 54 298 504 15 975 572 314 744 249 4 568 298 131 993 871 521 580 494 223 466 377 35 770 749 780 817 619 100 750 570 1 282 143 1 588 520 306 377 722 380 207 272 249 207 994 629 310 027 3421 1 090 844 961 104 611 4 583 655 75 661 737 46 729 625 33 675 675 160 755 302 19 783 779 6 028 481 186 567 563 28 437 936 1 198 992 1 199 979 987 356 81 634 414 81 634 770 111 271 698 297 839 261 114 059 735 114 059 735 114 461 092 178 744 670 TK, Arz ve Kullanm Tablolar, Girdi-kt Tablolan, 2012 TurkStat, Supply and Use Tables, Input-Output Tables, 2012 Considering the domestic 10 table of Turkey for the year of 2012, please calculate the followings for each sector and construct Hirschman categories. Direct backward linkage Direct forward linkage Total Backward Linkage Total Forward Linkage Total Backward linkage Index Total Forward linkage Index According to Hirschman classification, determine category I, category II, category Ill and category IV sector(s). Yurt ii Girdi-kt Tablosu, 2012 (temel fiyatlarla) () [cari fiyatlarla Domestic Input-Output Table, 2012 (at basic prices) (*) [at current prices INo (Bin TL) 2 3 4 5 6 7 8 Manufacture Construction Government Expend. 5 Gross Investment 10 043 890 Inventory 4 518 831 994 521 493 117 Agriculture 29 202 392 446 412 13 997 644 358 617 8 934 155 52 939 219 8 961 170 2 383 189 64 283 578 3 194 349 2 792 991 4791 2 797 782 Mining 116 910 1530 418 3 804 407 92 428 4 652 040 10 196 203 2 307 122 1 338 302 13 841 627 5 281 814 38 343 68 722 30 380 1 473 13 575 354 13 576 827 18 896 983 32 738 610 2 Household Consumption 66 528 522 2 292 572 249 522 905 1 973 241 570 669 176 890 986 416 52 133 4221 81 978 908 1 025 098 746 Services 4 470 807 1 519 104 114 403 497 14 386 180 298 073 441 432 853 028 58 005 362 34 980 551 525 838 940 300 913 100 5 160 173 7 703 110 2 542 937 28 465 060 496 217 320 524 682 379 830 755 652 1 356 594 593 11 493 642 5 382 206 869 433 218 368 456 4 570 737 462 509 223 401 702 4 Total Final Demand C + G 66 528 522 2 292 572 261 016 546 1 978 623 777 538 609 1109 354 872 56 704 1601 82 441 417 1 248 500 448 Total 88 193 223 24 055 160 522 611 535 66 135 148 477 329 181 1 178 324 246 312 523 8101 80 501 271 1 571 349 327 438 577 769 4 886 659 10 565 122 5 678 463 29 189 268 912 759 072 941 948 341 1 385 412 768 2 956 762 095 219 078 907 49 981 359 354 650 089 57 529 319 16 652 380 428 831 788 Sectors 1 Agriculture 2 Mining 3 Manufacture 4 Construction 5 Services Total P.7 thalat rn kullanimi, cif Imports cif D.21 - D.31 rn zerindeki vergi eksi sbvansiyonlar Taxes less subsid P.2 Toplam ara tketim / nihai tketim alc fiyatlaryla) Total intermedi: D.1 alanlara yaplan demeler Compensation of employees D.29-D.39 retim zerindeki dier net vergiler Other net taxes on product D.29 retim zerindeki dier vergiler Other taxes on production D.39 retim zerindeki dier sbvansiyonlar Other subsidies on product P.51c iletme artii zerindeki sabit sermaye tketimi Consumption off B2.n/B3.n letme art, net / Karma gelir, net Operating surplus, net/M B2.q isletme art, gayrisafi / Karma gelir, gayrisafi Operating surplus.gr B1.9 Gayrisafi katma deer temel fiyatlarla Value added at basic prices P.1 Toplam retim temel fiyatlarla) Output at basic prices (*) dzeltilmis corrected 8 177 418 2 191 872 12 072 998 1 293 070 2 084 488 15 450 556 Igross + Inven. 14 562 721 1 487 638 71 243 172 227 256 325 52 173 231 366 723 0871 58 822 388 18 736 869 444 282 3441 Exports X 9 460 204 4 903 240 235 973 709 2469 165 49 553 572 302 359 890 20 274 606 2 579 790 325 214 286 Total User Int.Dem+C+G+1 178 744 670 32 738 610 1 090 844 961 297 839 261 1 356 594 593 2 956 762 095 448 324 963 184 259 347 3 589 346 405 54 298 504 15 975 572 314 744 249 4 568 298 131 993 871 521 580 494 223 466 377 35 770 749 780 817 619 100 750 570 1 282 143 1 588 520 306 377 722 380 207 272 249 207 994 629 310 027 3421 1 090 844 961 104 611 4 583 655 75 661 737 46 729 625 33 675 675 160 755 302 19 783 779 6 028 481 186 567 563 28 437 936 1 198 992 1 199 979 987 356 81 634 414 81 634 770 111 271 698 297 839 261 114 059 735 114 059 735 114 461 092 178 744 670 TK, Arz ve Kullanm Tablolar, Girdi-kt Tablolan, 2012 TurkStat, Supply and Use Tables, Input-Output Tables, 2012 Considering the domestic 10 table of Turkey for the year of 2012, please calculate the followings for each sector and construct Hirschman categories. Direct backward linkage Direct forward linkage Total Backward Linkage Total Forward Linkage Total Backward linkage Index Total Forward linkage Index According to Hirschman classification, determine category I, category II, category Ill and category IV sector(s)
Step by Step Solution
There are 3 Steps involved in it

Get step-by-step solutions from verified subject matter experts