

Question: All the 3 questions are solved with this graph could you please answer them with details I kinda can't understand them. + + G $800
All the 3 questions are solved with this graph could you please answer them with details I kinda can't understand them.
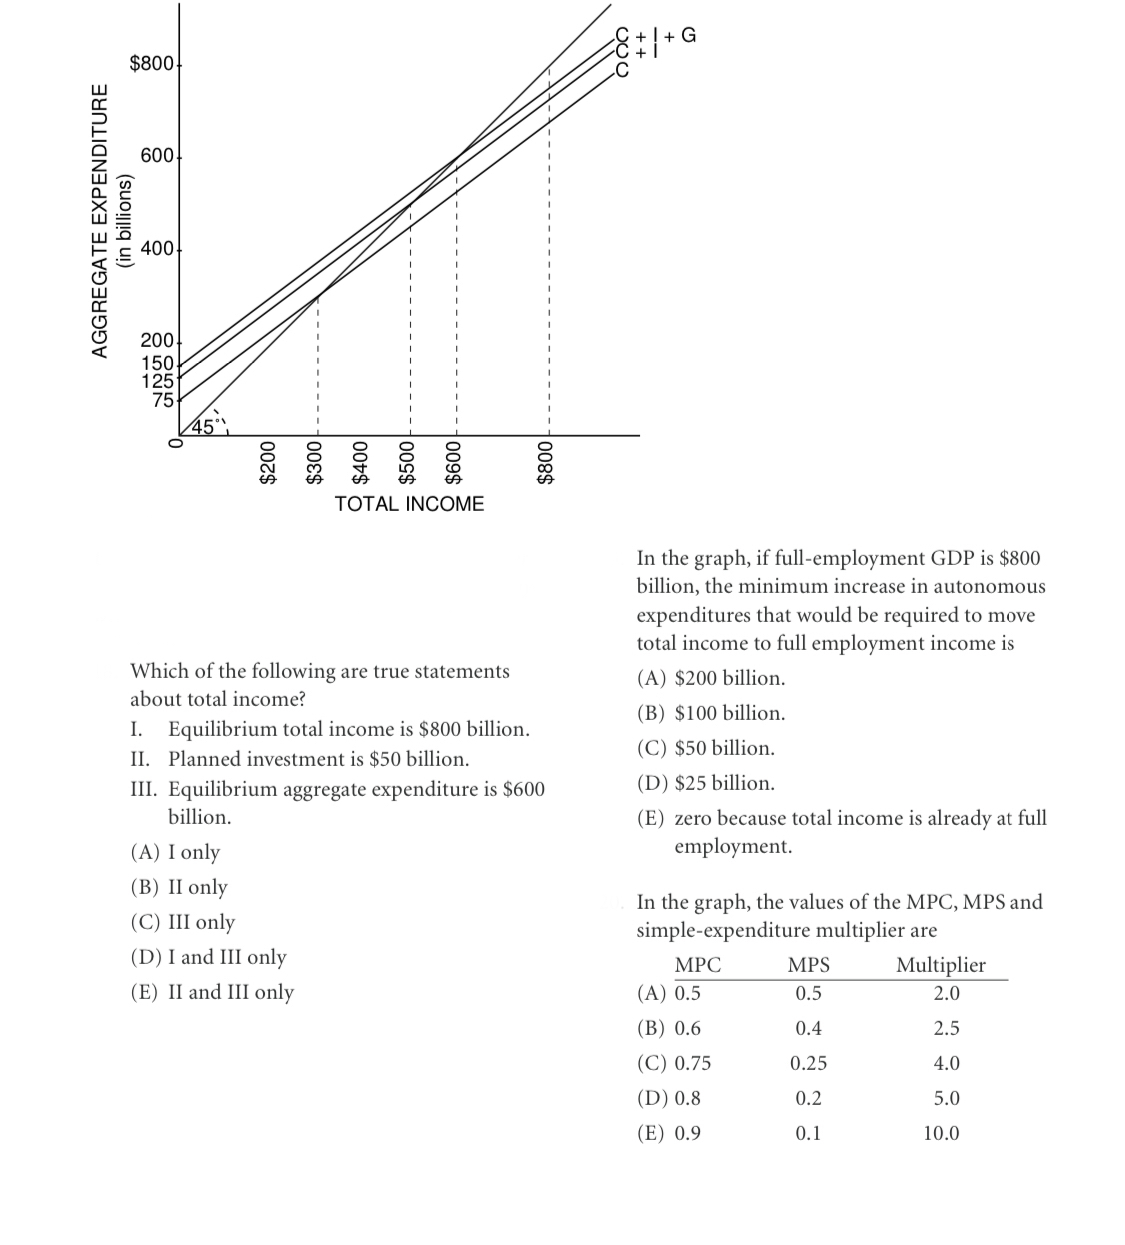
+ + G $800 AGGREGATE EXPENDITURE 600 (in billions) 400 200 150 $200 $300 $400 $500 $600 $800 TOTAL INCOME In the graph, if full-employment GDP is $800 billion, the minimum increase in autonomous expenditures that would be required to move total income to full employment income is Which of the following are true statements about total income? (A) $200 billion. I. Equilibrium total income is $800 billion. (B) $100 billion. II. Planned investment is $50 billion. (C) $50 billion. III. Equilibrium aggregate expenditure is $600 (D) $25 billion. billion. (E) zero because total income is already at full (A) I only employment. (B) II only (C) III only In the graph, the values of the MPC, MPS and simple-expenditure multiplier are (D) I and III only MPC MPS Multiplier (E) II and III only (A) 0.5 0.5 2.0 (B) 0.6 0.4 2.5 (C) 0.75 0.25 4.0 (D) 0.8 0.2 5.0 (E) 0.9 0.1 10.0
Step by Step Solution
There are 3 Steps involved in it

Get step-by-step solutions from verified subject matter experts