

Question: all the pics except for the last are just the financial statements. please answer the questions on the last pic December 31, 2016 KRW Samsung
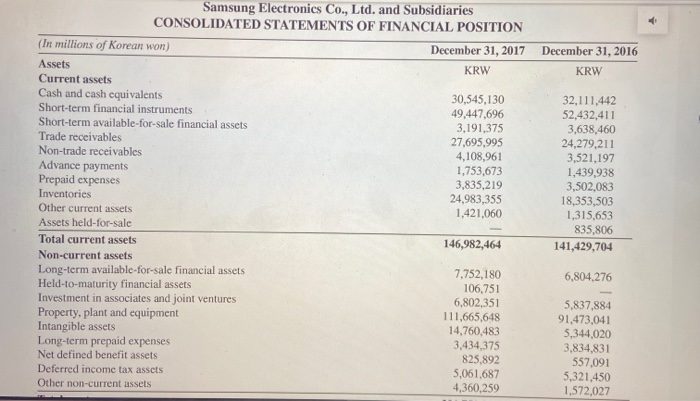
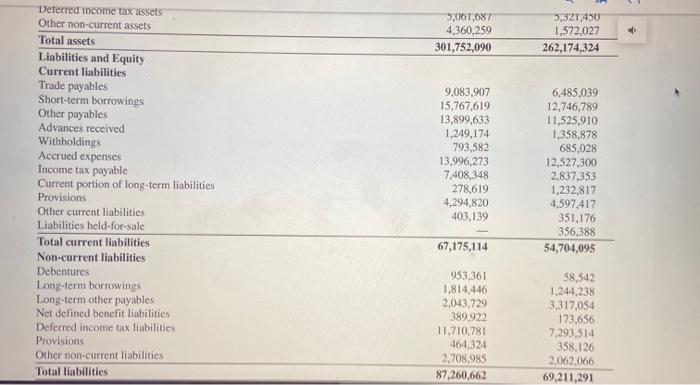
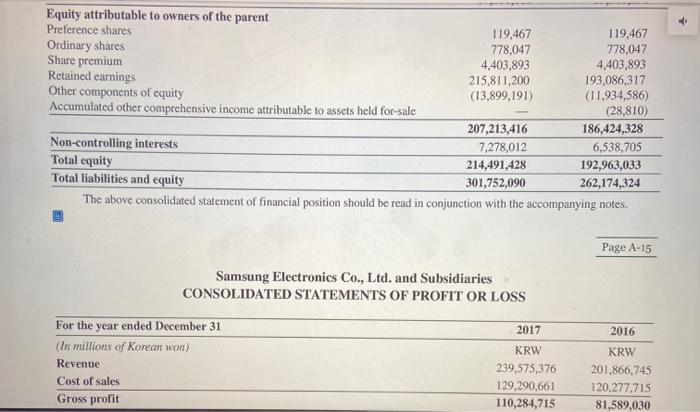
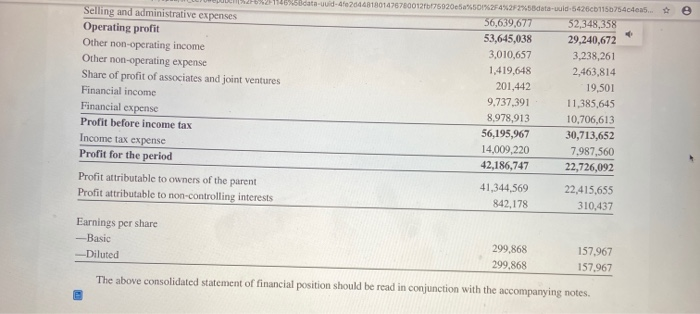
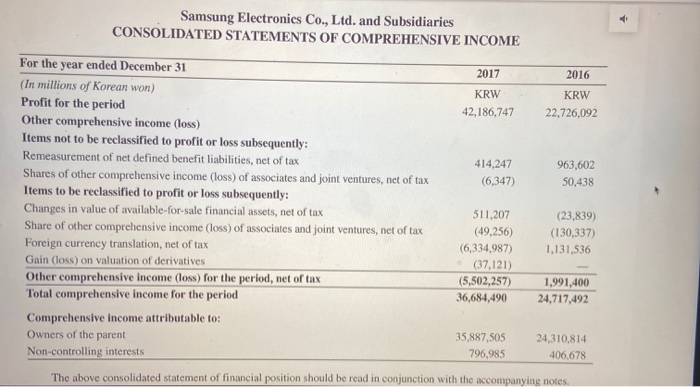
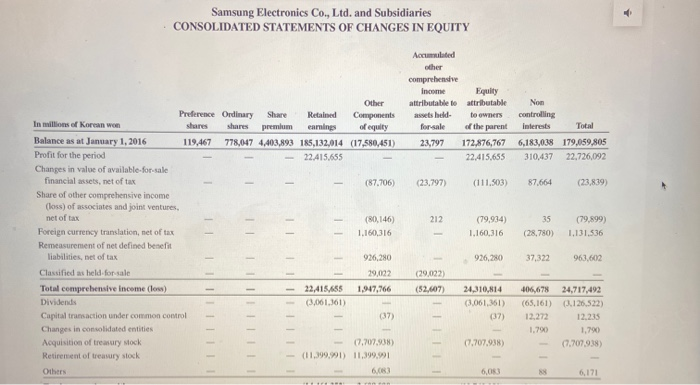
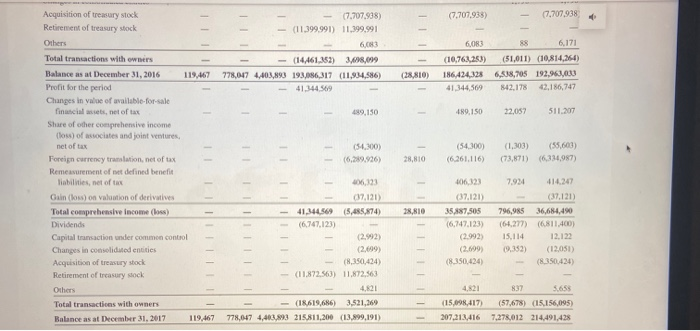
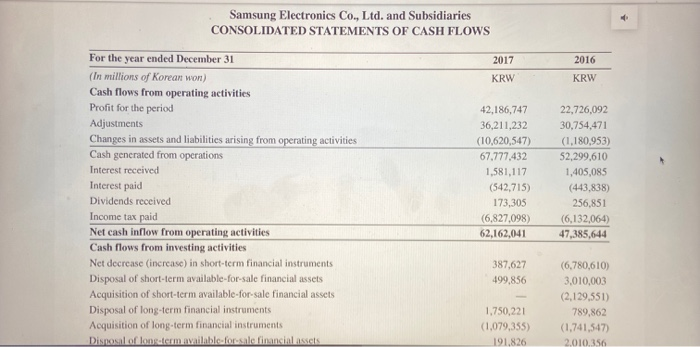
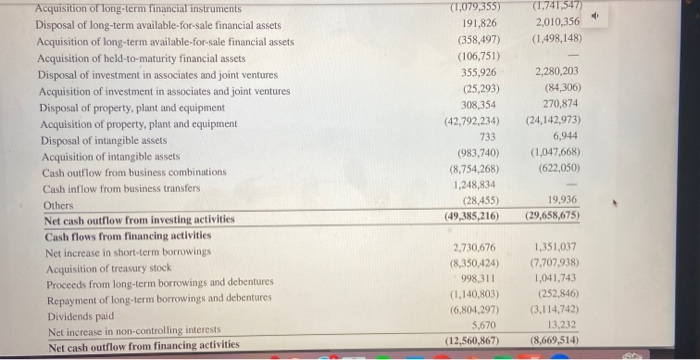
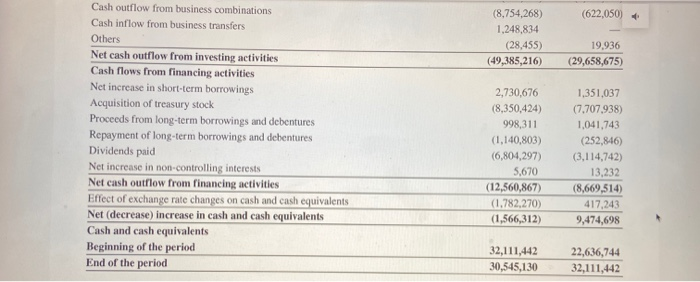
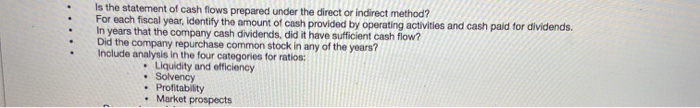
December 31, 2016 KRW Samsung Electronics Co., Ltd. and Subsidiaries CONSOLIDATED STATEMENTS OF FINANCIAL POSITION (In millions of Korean won) December 31, 2017 Assets KRW Current assets Cash and cash equivalents 30,545,130 Short-term financial instruments 49,447,696 Short-term available-for-sale financial assets 3,191,375 Trade receivables 27,695,995 Non-trade receivables 4,108,961 Advance payments 1,753,673 Prepaid expenses 3,835,219 Inventories 24,983,355 Other current assets 1,421,060 Assets held-for-sale Total current assets 146,982,464 Non-current assets Long-term available-for-sale financial assets 7,752,180 Held-to-maturity financial assets 106,751 Investment in associates and joint ventures 6,802,351 Property, plant and equipment 111,665,648 Intangible assets 14,760,483 Long-term prepaid expenses 3,434,375 Net defined benefit assets 825,892 Deferred income tax assets 5,061.687 Other non-current assets 4,360,259 32,111,442 52,432,411 3,638,460 24,279,211 3,521,197 1,439,938 3,502,083 18,353,503 1,315,653 835,806 141,429,704 6,804,276 5,837,884 91,473,041 5,344,020 3,834,831 557,091 5,321,450 1,572,027 5,061,687 4,360,259 301,752,090 3,321,450 1,572,027 262,174,324 Deferred Income tax assets Other non-current assets Total assets Liabilities and Equity Current liabilities Trade payables Short-term borrowings Other payables Advances received Withholdings Accrued expenses Income tax payable Current portion of long-term liabilities Provisions Other current liabilities Liabilities held-for-sale Total current liabilities Non-current liabilities Debentures Long-term borrowings Long-term other payables Net defined benefit liabilities Deferred income tax liabilities Provisions Other non-current liabilities Total liabilities 9,083,907 15,767.619 13,899,633 1,249,174 793,582 13,996,273 7,408,348 278,619 4,294,820 403,139 6,485.039 12,746,789 11,525,910 1,358,878 685,028 12,527,300 2,837,353 1,232,817 4,597,417 351,176 356,388 54,704,095 67,175,114 953,361 1,814,446 2,043,729 389.922 11.710,781 464,324 2,708,985 87,260,662 58,542 1,244,238 3,317,054 173,656 7,293,514 358,126 2,062,066 69,211,291 Equity attributable to owners of the parent Preference shares 119,467 119,467 Ordinary shares 778,047 778,047 Share premium 4,403,893 4,403,893 Retained earnings 215,811,200 193,086,317 Other components of equity (13,899,191) (11,934,586) Accumulated other comprehensive income attributable to assets held for-sale (28,810) 207,213,416 186,424,328 Non-controlling interests 7,278,012 6,538,705 Total equity 214,491,428 192,963,033 Total liabilities and equity 301,752,090 262,174,324 The above consolidated statement of financial position should be read in conjunction with the accompanying notes. Page A-15 Samsung Electronics Co., Ltd. and Subsidiaries CONSOLIDATED STATEMENTS OF PROFIT OR LOSS 2016 For the year ended December 31 (In millions of Korean won) Revenue Cost of sales Gross profit 2017 KRW 239,575,376 129,290,661 110,284,715 KRW 201,866,745 120,277,715 81,589,030 u rd-4720448180147878001275020 H Selling and administrative expenses Operating profit Other non-operating income Other non-operating expense Share of profit of associates and joint ventures Financial income Financial expense Profit before income tax Income tax expense Profit for the period 2 4%2F2%.58data-uuid-642061150/dolea 56,639,677 52,348,358 53,645,038 29,240,672 3,010,657 3,238,261 1,419,648 2,463,814 201,442 19,501 9,737,391 11,385,645 8,978,913 10,706,613 56,195,967 30,713,652 14,009,220 7,987,560 42,186,747 22,726,092 Profit attributable to owners of the parent Profit attributable to non-controlling interests 41,344,569 842,178 22,415,655 310,437 Earnings per share -Basic -Diluted 299,868 299,868 157,967 157.967 The above consolidated statement of financial position should be read in conjunction with the accompanying notes Samsung Electronics Co., Ltd. and Subsidiaries CONSOLIDATED STATEMENTS OF COMPREHENSIVE INCOME 2017 2016 KRW 42,186,747 KRW 22,726,092 For the year ended December 31 (in millions of Korean won) Profit for the period Other comprehensive income (loss) Items not to be reclassified to profit or loss subsequently: Remeasurement of net defined benefit liabilities, net of tax Shares of other comprehensive income (loss) of associates and joint ventures, net of tax Items to be reclassified to profit or loss subsequently: Changes in value of available for sale financial assets, net of tax Share of other comprehensive income (loss) of associates and joint ventures, net of tax Foreign currency translation, net of tax Gain (loss) on valuation of derivatives Other comprehensive income (loss) for the period, net of tax Total comprehensive income for the period 414,247 (6,347) 963,602 50,438 511,207 (49,256) (6,334,987) (37,121) (5,502,257) 36,684,490 (23,839) (130,337) 1,131,536 1,991,400 24,717,492 Comprehensive income attributable to: Owners of the parent Non-controlling interests 35,887,505 796,985 24,310,814 406,678 The above consolidated statement of financial position should be read in conjunction with the accompanying notes Samsung Electronics Co., Ltd. and Subsidiaries CONSOLIDATED STATEMENTS OF CHANGES IN EQUITY Accumulated other comprehensive income attributable to es held for sale 23,797 Equity attributable to owners of the parent 172,876,767 22.415.655 Non controlling interests 6,183,038 310,437 Total 179,059.805 22.726,092 (23.797) (111.503) 87.664 (23,839) 212 Other Preference Ordinary Share Retained Components In millions of Korean won shares shares premium eamings o fequity Balance as at January 1, 2016 119,467 778,047 4.403,893 185,132,014 (17,580,451) Profit for the period - 22.415.655 Changes in value of available for sale financial assets, net of tax (87.706) Share of other comprehensive income (loss) of associates and joint ventures, net of tax (80,146) Foreign currency translation, met of tax 1.160.316 Remeasurement of net defined benefit liabilities, net of tax 926,280 Classified as held for sale 29,022 Total comprehensive income (los) 22,415.655 1,947,766 Dividends (3,061.361) Capital transaction under common control Changes in consolidated entities Acquisition of treasury Mock 67.707.938) Retirement of treasury stock - (11.199.991) 11.199.991 (79,934) 1.160,316 15 (28,780) (79 999) 1.131.536 926,280 963,602 (29,022 (52,607) 24,310,814 (3,061,361) II IIIII!!! 406,678 (65,161) III (37) 24,717,492 3.126,522) 12,235 1.790 (7.707.938) (7.707.938) Others 6.00 6.171 (7.707.938) 7.707,938 Acquisition of treasury stock Retirement of treasury stock Others - 7.707.938) - (11.399.991) 11,399.991 603 - (14,461,352) 3,6/38,099 77007 4.403. 19306317 (11,934.586) - 41.344.569 40.7612 ) 51,011) (10.814,264) (28.80) 186424338 41.344.500 6.838,705 42.178 193.96.2003 2,186,747 189,150 489.150 32,057 $11.207 (54.300) (629,926) (54,300) (6.261,116) (1,303) (73,871) (55,603) 6.334,987) 2010 06.121 7.934 414.247 Total transactions with awer Balance as at December 31, 2016 119.467 Profit for the period Changes in value of available for sale financial set, net of tax Share of other comprehensive income (los) of associates and joint ventures, net of tax Foreign currency tration, net of tax Remeurement of net defined benefit Tables et ofta Cuin ( s) on Valuation of derivatives Total comprehensive Income (los) Dividends Capital transaction under common control Changes in consolidated entities Acquisition of treasury stock Retirement of treasury sock Others Total transactions with owners Balance as at the 31, 2017 119,467 120 (32,121) (17,121) (5,435.874) 41.344.569 (6,767.123) 36,684,490 11.400 35,887,505 (6,747.123) (2092) (2.699) (8.350.404) 796,985 (64277) 15.114 9.352) (2.699) (8.350,424) (11.8725) 11.8722563 (12.051 1430 (IR 619,686) 3521.269 4.521 655 15. 417) (57.67%)(15156.005) 207,213,4167.278.012 214,491,428 776,047 4. 215 .00 (13 99,191) Samsung Electronics Co., Ltd. and Subsidiaries CONSOLIDATED STATEMENTS OF CASH FLOWS 2017 KRW 2016 KRW For the year ended December 31 (In millions of Korean won) Cash flows from operating activities Profit for the period Adjustments Changes in assets and liabilities arising from operating activities Cash generated from operations Interest received Interest paid Dividends received Income tax paid Net cash inflow from operating activities Cash flows from investing activities Net decrease increase) in short-term financial instruments Disposal of short-term available for sale financial assets Acquisition of short-term available for sale financial assets Disposal of long-term financial instruments Acquisition of long-term financial instruments Disposal of long term available for sale financial assets 42,186,747 36,211,232 (10,620,547) 67.777.432 1,581,117 (542,715) 173,305 (6,827,098) 62,162,041 22,726,092 30,754,471 (1.180,953) 52,299.610 1,405,085 256,851 (6,132,064) 47,385,644 387,627 499,856 (6,780,610) 3,010,003 (2,129,551) 789,862 (1,741,547) 2.010.356 1,750,221 (1,079,355) 191.826 (1,741,547) 2,010,356 (1.498,148) Acquisition of long-term financial instruments Disposal of long-term available for sale financial assets Acquisition of long-term available for sale financial assets Acquisition of held-to-maturity financial assets Disposal of investment in associates and joint ventures Acquisition of investment in associates and joint ventures Disposal of property, plant and equipment Acquisition of property, plant and equipment Disposal of intangible assets Acquisition of intangible assets Cash outflow from business combinations Cash inflow from business transfers Others Net cash outflow from investing activities Cash flows from financing activities Net increase in short-term borrowings Acquisition of treasury stock Proceeds from long-term borrowings and debentures Repayment of long-term borrowings and debentures Dividends paid Net increase in non-controlling interests Net cash outflow from financing activities (1,079,355) 191,826 (358,497) (106,751) 355,926 (25,293) 308,354 (42,792,234) 733 (983,740) (8.754,268) 1,248,834 (28,455) (49,385,216) 2,280,203 (84,306) 270,874 (24,142,973) 6,944 (1,047,668) (622,050) 19,936 (29,658,675) 2,730,676 (8,350,424) 998,311 (1.140,803) (6,804,297) 5.670 (12,560,867) 1,351,037 (7,707,938) 1,041,743 (252,846) (3,114,742) 13,232 (8,669,514) (622,050) - (8,754,268) 1,248,834 (28,455) (49,385,216) 19.936 (29,658,675) Cash outflow from business combinations Cash inflow from business transfers Others Net cash outflow from investing activities Cash flows from financing activities Net increase in short-term borrowings Acquisition of treasury stock Proceeds from long-term borrowings and debentures Repayment of long-term borrowings and debentures Dividends paid Net increase in non-controlling interests Net cash outflow from financing activities Effect of exchange rate changes on cash and cash equivalents Net (decrease) increase in cash and cash equivalents Cash and cash equivalents Beginning of the period End of the period 2,730,676 (8,350,424) 998,311 (1,140,803) (6,804,297) 5,670 (12,560,867) (1.782.270) (1,566,312) 1,351,037 (7,707,938) 1,041,743 (252,846) (3,114,742) 13,232 (8,669,514) 417,243 9,474,698 32,111,442 30,545,130 22,636,744 32,111,442 Is the statement of cash flows prepared under the direct or indirect method? For each fiscal year, identify the amount of cash provided by operating activities and cash paid for dividends. In years that the company cash dividends, did it have sufficient cash flow? Did the company repurchase common stock in any of the years? Include analysis in the four categories for ratios: Liquidity and efficiency Solvency Profitability Market prospects
Step by Step Solution
There are 3 Steps involved in it

Get step-by-step solutions from verified subject matter experts