

Question: all the same question Required information [The following information applies to the questions displayed below.) Selected comparative financial statements of Korbin Company follow: 2015 KORBIN
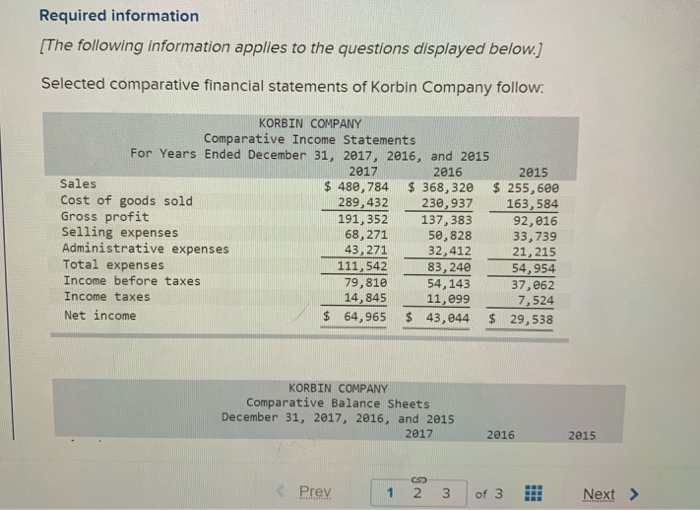
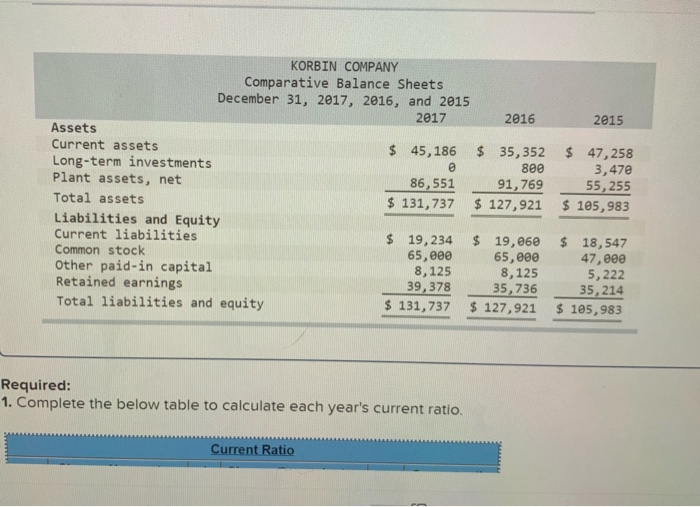
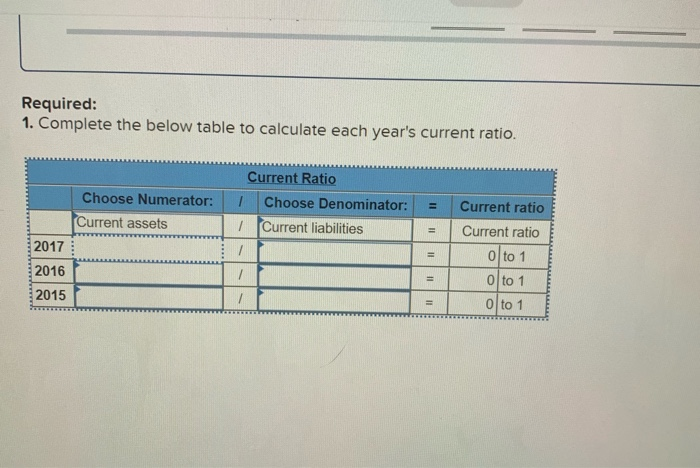
Required information [The following information applies to the questions displayed below.) Selected comparative financial statements of Korbin Company follow: 2015 KORBIN COMPANY Comparative Income Statements For Years Ended December 31, 2017, 2016, and 2015 2017 2016 Sales $ 480,784 $ 368, 320 $ 255,600 Cost of goods sold 289,432 230,937 163,584 Gross profit 191,352 137,383 92,016 Selling expenses 68,271 50,828 33,739 Administrative expenses 43,271 32,412 21, 215 Total expenses 111,542 83,240 54,954 Income before taxes 79,810 54, 143 37,062 Income taxes 14,845 1 1,099 7,524 Net income $ 64,965 $ 43,044 $ 29,538 KORBIN COMPANY Comparative Balance Sheets December 31, 2017, 2016, and 2015 2017 2016 2015 2015 8ee KORBIN COMPANY Comparative Balance Sheets December 31, 2017, 2016, and 2015 2017 2016 Assets Current assets $ 45,186 $ 35,352 Long-term investments Plant assets, net 86,551 91,769 Total assets $ 131, 737 $ 127,921 Liabilities and Equity Current liabilities $ 19, 234 $ 19,060 Common stock 65,000 65,000 Other paid-in capital 8,125 8,125 Retained earnings 39,378 35,736 Total liabilities and equity $ 131, 737 $ 127,921 $ 47,258 3,47 55,255 $ 105,983 $ 18,547 47,000 5,222 35, 214 $ 105,983 Required: 1. Complete the below table to calculate each year's current ratio. Current Ratio Required: 1. Complete the below table to calculate each year's current ratio. Choose Numerator: Current assets Current Ratio I Choose Denominator: 1 Current liabilities = = 2017 Current ratio Current ratio 0 to 1 0 to 1 0 to 1 2016 2015
Step by Step Solution
There are 3 Steps involved in it

Get step-by-step solutions from verified subject matter experts