

Question: All, using the format from chapter 5, calculate the annual cash burn and cash build for 2-years for the example provided in the pdf named

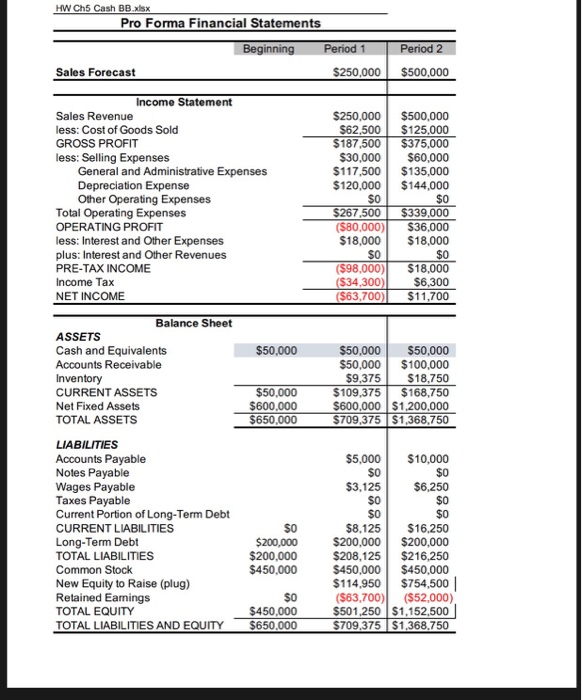
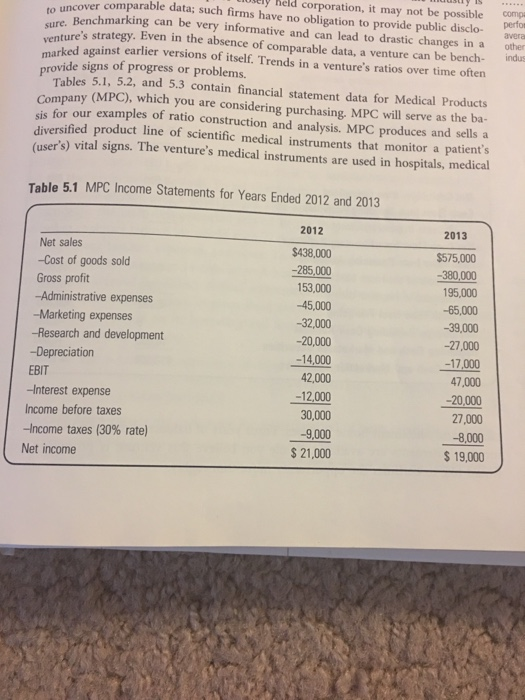
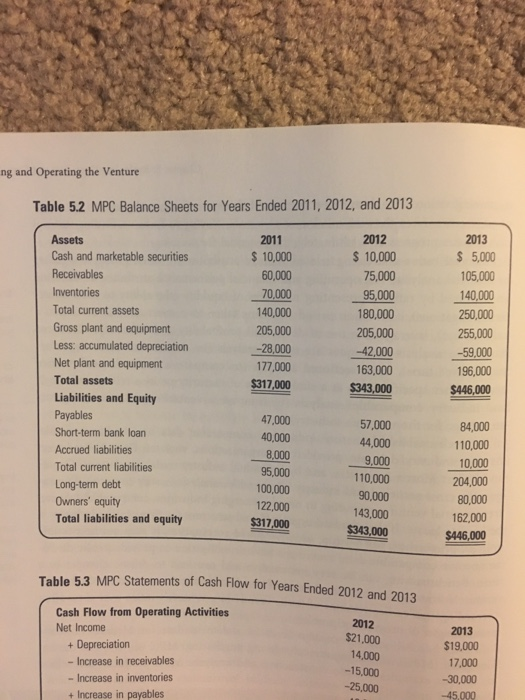
All, using the format from chapter 5, calculate the annual cash burn and cash build for 2-years for the example provided in the pdf named" 19WHw Ch5 Cash BB.pdf" under the Homework folder. I will also be posting the spreadsheet (equation) presented in class on Thursday which you may use to complete the assignment. Note, the company successfully raised $650,00 to start the business. What will the entrepreneur be able to tell Investors regarding any Net Cash Burn in years 1 and 2 and the potential need for additional start-up capital? HW Ch5 Cash BB.xsx Pro Forma Financial Statements Sales Forecast $250,000 $500,000 Income Statement Sales Revenue less: Cost of Goods Sold GROSS PROFIT less: Selling Expenses $250,000 $500,000 $62,500 $125,000 $187,500 $375,000 30,000$60,000 $117,500 $135,000 $120,000 $144,000 General and Administrative Expenses Depreciation Expense Other Operating Expenses S0 Total Operating Expenses OPERATING PROFIT less: Interest and Other Expenses plus: Interest and Other Revenues PRE-TAX INCOME Income Tax NET INCOME $267,500 $339,000 ($80,000) S36,000 $18,000$18,000 S0 (S98,000$18,000 $34,300 $6,300 ($63,700)$11,700 Balance Sheet ASSETS Cash and Equivalents Accounts Receivable Inventory CURRENT ASSETS Net Fixed Assets TOTAL ASSETS $50,000 $50,000 $50,000 $50,000 $100,000 9,375$18,750 $109,375 $168,750 S600,000 S1,200,000 $709,375 $1,368,750 $50,000 $600.000 $650,000 LIABILITIES Accounts Payable Notes Payable Wages Payable Taxes Payable Current Portion of Long-Term Debt CURRENT LIABILITIES Long-Term Debt TOTAL LIABILITIES Common Stock New Equity to Raise (plug) Retained Earnings TOTAL EQUITY TOTAL LIABILITIES AND EQUITY $5,000 $10,000 $0 $6,250 SO $0 $8.125 $16,250 $200,000 $200,000 $208,125 $216,250 $450,000 $450,000 S0 $3,125 SO S0 SO $200,000 $450,000 So $450,000 $650,000 $114,950 $754,500 ($63,700) ($52,000) S501,250 $1,152,500 S709,375 $1,368,750 ve comparable data; such firms have no obligation to provide public disclo- avera ey held corporation, it may not be possible como perfor in a other indus to uncover Benchmarking can be very informative and can lead to drastic changes ure's strategy. Even in the absence of comparable data, a venture can ked against earlier versions of itself. Trends in a venture's ratios over time often be bench provide signs of progress or problems. Tables 5.1, 5.2, and 5.3 contain financial statement data for Medical Products Company (MPC), which you are considering purchasing, MPC will serve as the ba- sis for our examples of ratio construction and analysis. MPC produces and sells a diversified product line of scientific medical instruments that monitor a patient's (user's) vital signs. The venture's medical instruments are used in hospitals, medical Table 5.1 MPC Income Statements for Years Ended 2012 and 2013 2012 2013 Net sales -Cost of goods sold Gross profit -Administrative expenses -Marketing expenses -Research and development -Depreciation EBIT -Interest expense Income before taxes -Income taxes (30% rate) $438,000 -285,000 153,000 45,000 -32,000 -20,000 -14,000 42,000 -12,000 30,000 -9,000 $21,000 $575,000 -380,000 195,000 -65,000 -39,000 -27,000 17,000 7,000 -20,000 27,000 -8,000 $ 19,000 Net income ng and Operating the Venture Table 5.2 MPC Balance Sheets for Years Ended 2011, 2012, and 2013 2012 S 10,000 75,000 95,000 180,000 205,000 -42,000 163,000 2013 5,000 105,000 140,000 250,000 255,000 -59,000 196,000 Assets Cash and marketable securities Receivables Inventories Total current assets Gross plant and equipment Less: accumulated depreciation Net plant and equipment Total assets Liabilities and Equity Payables Short-term bank loan Accrued liabilities Total current liabilities Long-term debt Owners' equity Total liabilities and equity 2011 10,000 60,000 70,000 140,000 205,000 -28,000 177,000 $317,00 3,000$446,000 47,000 40,000 8,000 95,000 100,000 122,000 $317,000 57,000 44,000 9,000 110,000 90,000 143,000 84,000 110,000 10,000 204,000 80,000 162,000 $446,000 $343,000 Table 5.3 MPC Statements of Cash Flow for Years Ended 2012 and 2013 Cash Flow from Operating Activities Net Income + Depreciation - Increase in receivables -Increase in inventories + Increase in payables 2012 $21,000 14,000 -15,000 -25,000 2013 $19,000 17,000 -30,000 -45,000
Step by Step Solution
There are 3 Steps involved in it

Get step-by-step solutions from verified subject matter experts