

Question: a.Look at the coefficient for Days.If this variable contributes any useful additional information that the HS average did not, then the coefficient should be different
a.Look at the coefficient for "Days".If this variable contributes any useful additional information that the HS average did not, then the coefficient should be different from zero.The value in the table is only an estimate, so although it may not be exactly zero, do you think that this difference is just estimation error?Using the Empirical Rule, what are the highest and lowest values that you think are plausible for this estimate?
b.Compare the R-square and the model's standard error to the values found when only HS average was used to predict GPA.Is the model better?
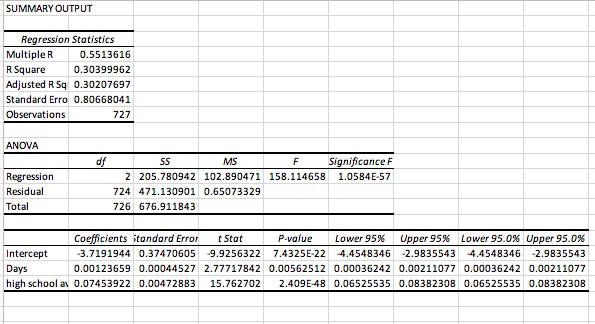
SUMMARY OUTPUT Regression Statistics Multiple R 0.5513616 R Square 0.30399962 Adjusted R Sq 0.30207697 Standard Erro 0.80668041 Observations 727 ANOVA of MS F Significance F Regression 2 205.780942 102.890471 158.114658 1.0584E-57 Residual 724 471.130901 0.65073329 Total 726 676.911843 Coefficients itandard Error t Stot P-value Lower 95% Upper 95% Lower 95.0% Upper 95.0% Intercept -3.7191944 0.37470605 -9.9256322 7.4325E-22 4.4548346 -2.9835543 4.4548346 -2.9835543 Day's 0.00123659 0.00044527 2.77717842 0.00562512 0.00036242 0.00211077 0.00036242 0.00211077 high school ed 0.07453922 0.00472883 15.762702 2.409E-48 0.06525535 0.08382308 0.06525535 0.08382308
Step by Step Solution
There are 3 Steps involved in it

Get step-by-step solutions from verified subject matter experts