

Question: Also, can you explain how the response rate is equal to 8%. a. The Big Bears Company sells products and is planning to print a
Also, can you explain how the response rate is equal to 8%.
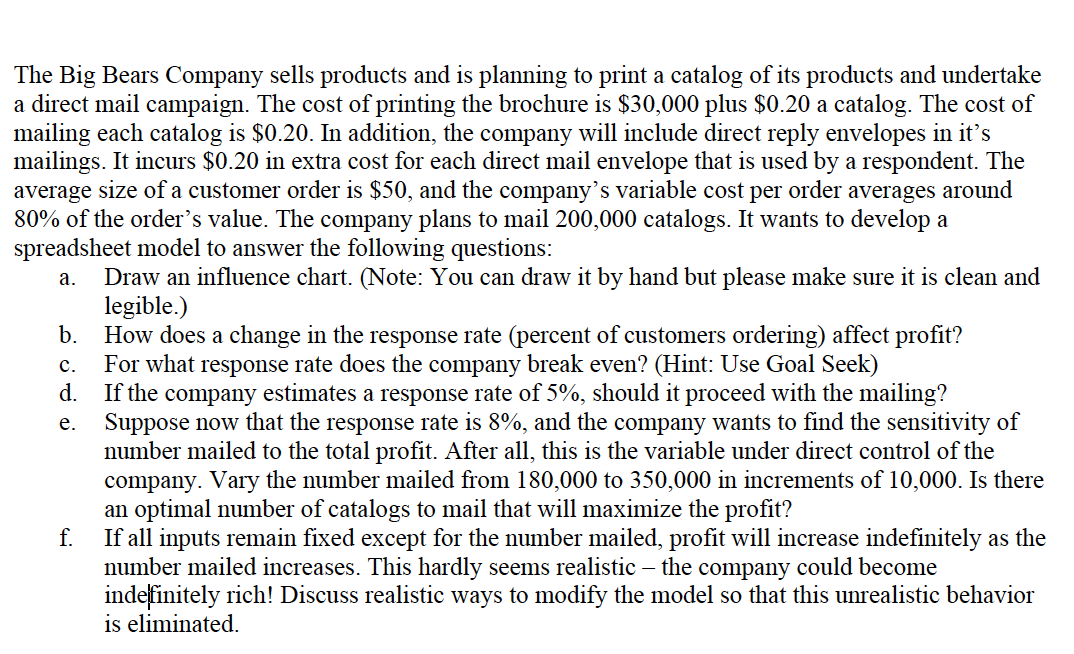
a. The Big Bears Company sells products and is planning to print a catalog of its products and undertake a direct mail campaign. The cost of printing the brochure is $30,000 plus $0.20 a catalog. The cost of mailing each catalog is $0.20. In addition, the company will include direct reply envelopes in it's mailings. It incurs $0.20 in extra cost for each direct mail envelope that is used by a respondent. The average size of a customer order is $50, and the company's variable cost per order averages around 80% of the order's value. The company plans to mail 200,000 catalogs. It wants to develop a spreadsheet model to answer the following questions: Draw an influence chart. (Note: You can draw it by hand but please make sure it is clean and legible.) b. How does a change in the response rate (percent of customers ordering) affect profit? For what response rate does the company break even? (Hint: Use Goal Seek) d. If the company estimates a response rate of 5%, should it proceed with the mailing? e. Suppose now that the response rate is 8%, and the company wants to find the sensitivity of number mailed to the total profit. After all, this is the variable under direct control of the company. Vary the number mailed from 180,000 to 350,000 in increments of 10,000. Is there an optimal number of catalogs to mail that will maximize the profit? f. If all inputs remain fixed except for the number mailed, profit will increase indefinitely as the number mailed increases. This hardly seems realistic the company could become indefinitely rich! Discuss realistic ways to modify the model so that this unrealistic behavior is eliminated. c. a. The Big Bears Company sells products and is planning to print a catalog of its products and undertake a direct mail campaign. The cost of printing the brochure is $30,000 plus $0.20 a catalog. The cost of mailing each catalog is $0.20. In addition, the company will include direct reply envelopes in it's mailings. It incurs $0.20 in extra cost for each direct mail envelope that is used by a respondent. The average size of a customer order is $50, and the company's variable cost per order averages around 80% of the order's value. The company plans to mail 200,000 catalogs. It wants to develop a spreadsheet model to answer the following questions: Draw an influence chart. (Note: You can draw it by hand but please make sure it is clean and legible.) b. How does a change in the response rate (percent of customers ordering) affect profit? For what response rate does the company break even? (Hint: Use Goal Seek) d. If the company estimates a response rate of 5%, should it proceed with the mailing? e. Suppose now that the response rate is 8%, and the company wants to find the sensitivity of number mailed to the total profit. After all, this is the variable under direct control of the company. Vary the number mailed from 180,000 to 350,000 in increments of 10,000. Is there an optimal number of catalogs to mail that will maximize the profit? f. If all inputs remain fixed except for the number mailed, profit will increase indefinitely as the number mailed increases. This hardly seems realistic the company could become indefinitely rich! Discuss realistic ways to modify the model so that this unrealistic behavior is eliminated. c
Step by Step Solution
There are 3 Steps involved in it

Get step-by-step solutions from verified subject matter experts