

Question: Also, describe the correlation, interpret the correlation and find the critical value. Thank you! Need it ASAP The accompanying table shows the maximum weights (in
Also, describe the correlation, interpret the correlation and find the critical value. Thank you! Need it ASAP

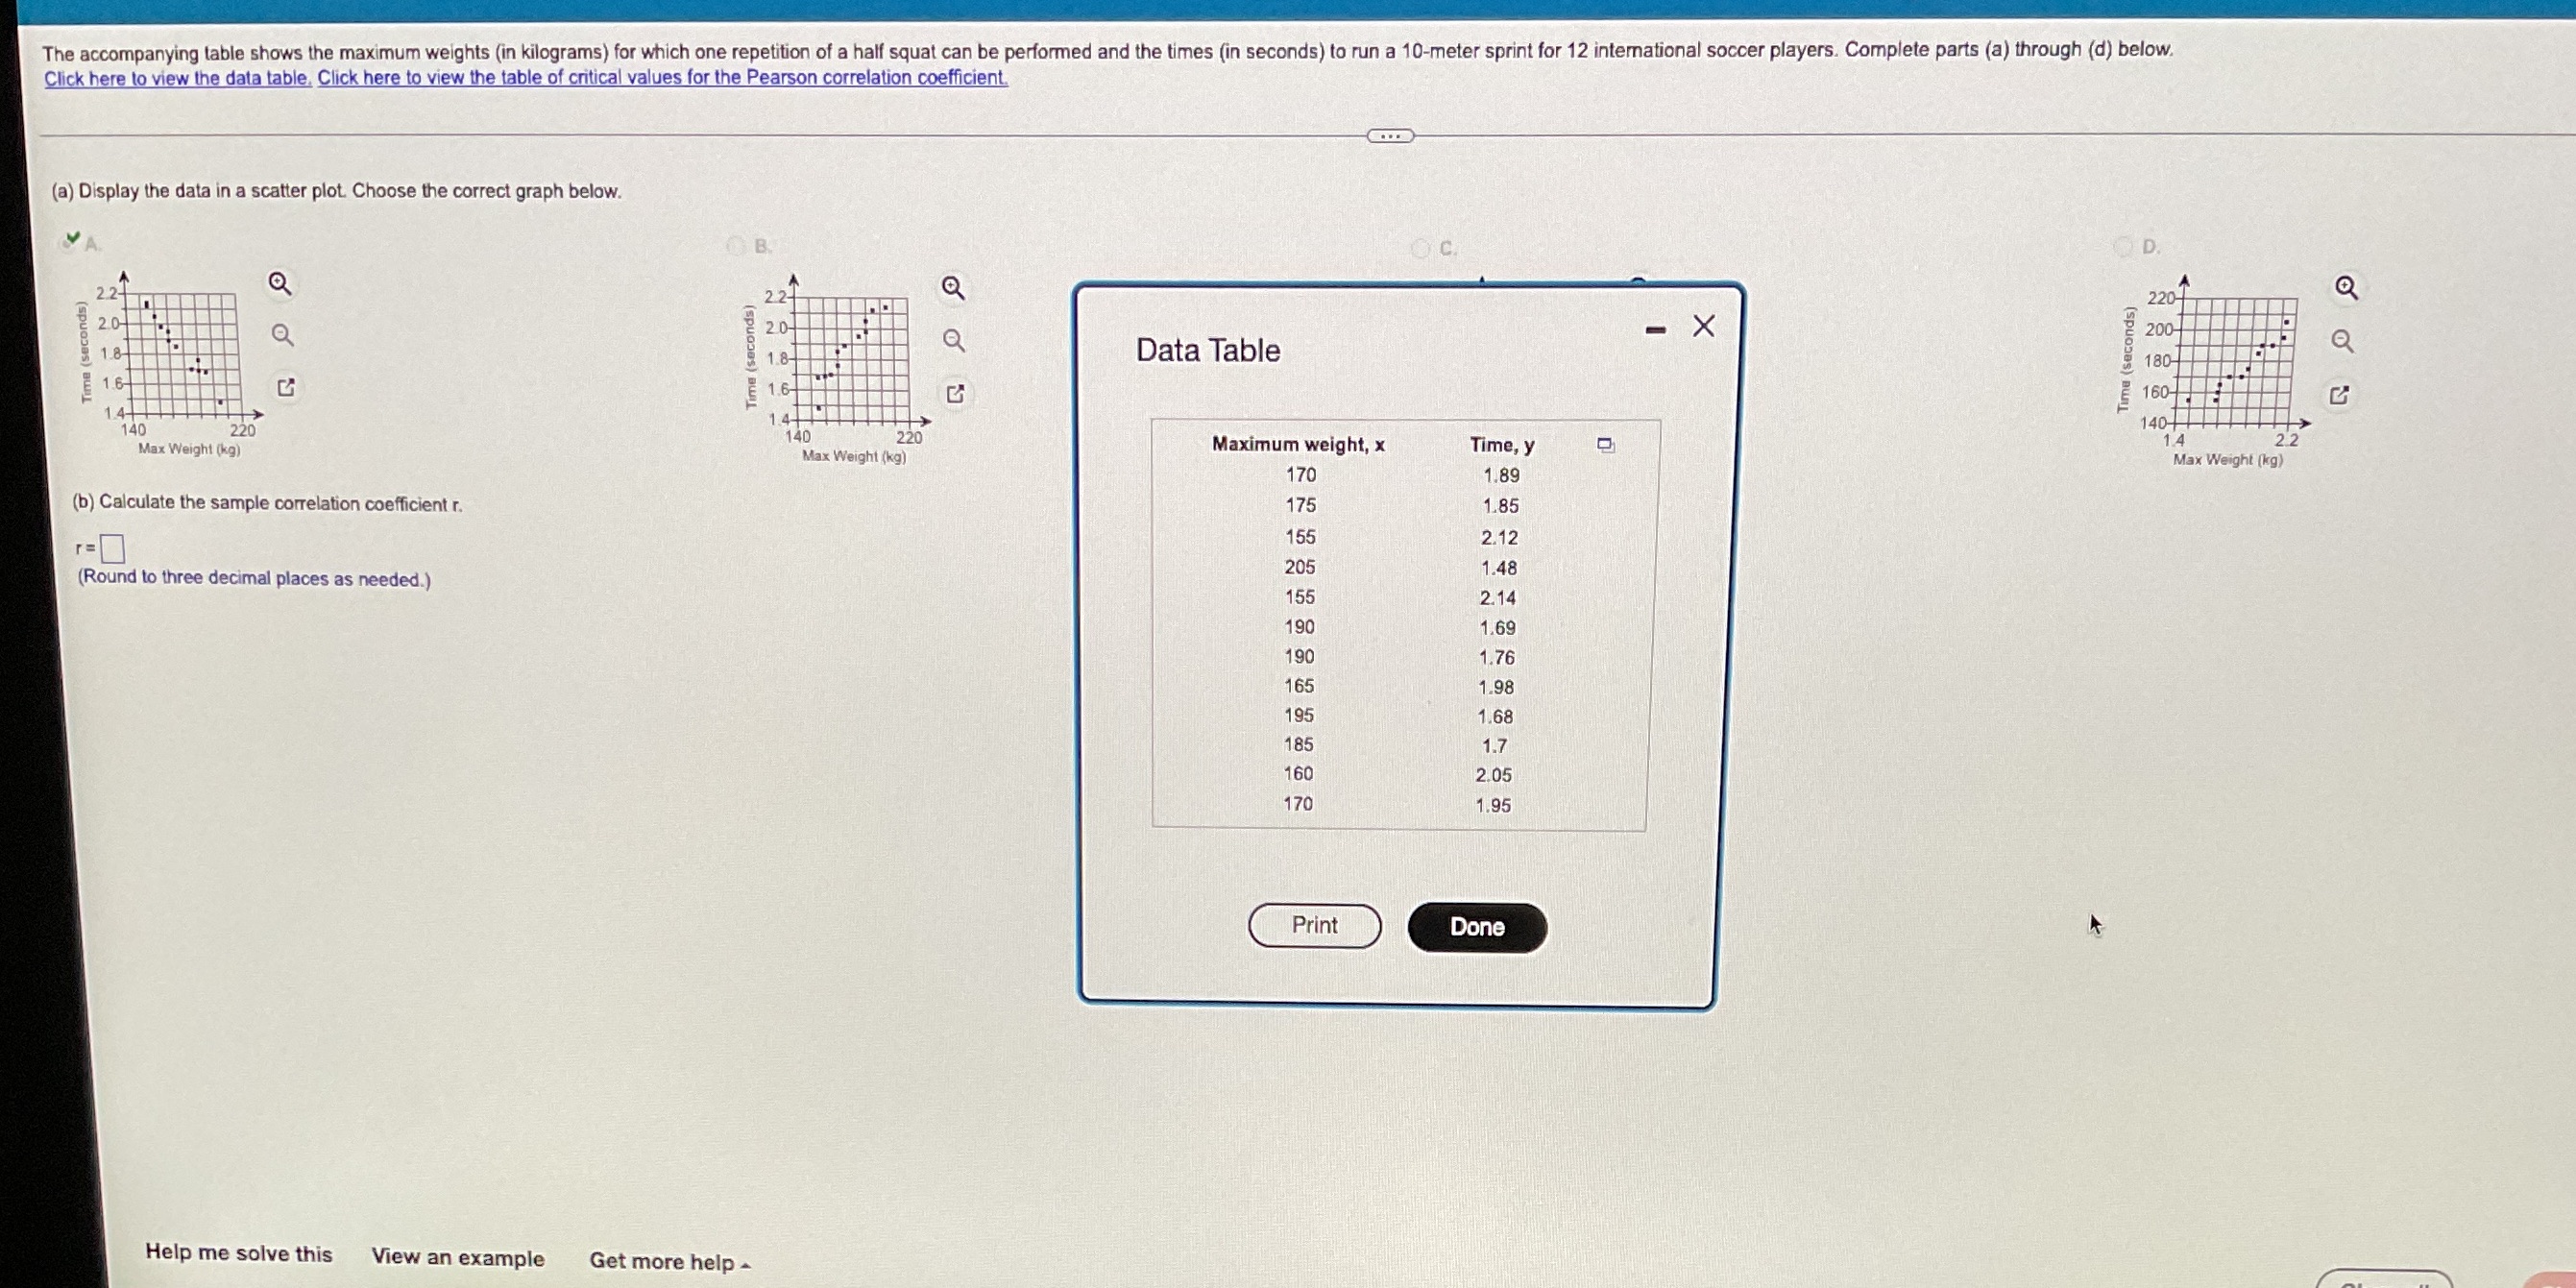
The accompanying table shows the maximum weights (in kilograms) for which one repetition of a half squat can be performed and the times (in seconds) to run a 10-meter sprint for 12 international soccer players. Complete parts (a) through (d) below. Click here to view the data table, Click here to view the table of critical values for the Pearson correlation coefficient (@) Display the data in a scatter plot. Choose the correct graph below. B OC. D 2.24 Q 2 2 229 conds 20 20 - X 200- 18 Q Time (seconds) 18 Data Table Time (seconds) 180 1.6 16 14 4 140 220 140- 140 Max Weight (kg) 220 Maximum weight, x Time, y 14 2 2 Max Weight (kg) Max Weight (kg) 170 1.89 (b) Calculate the sample correlation coefficient r. 175 1.85 155 2.12 (Round to three decimal places as needed.) 205 1.48 155 2.14 190 1.69 190 1.76 165 1.98 195 1.68 185 1.7 160 2.05 170 1.95 Print Done Help me solve this View an example Get more help
Step by Step Solution
There are 3 Steps involved in it

Get step-by-step solutions from verified subject matter experts