Question: Also give me a step by step instructions on how to do it on Enterprise dynamics software as well Assessment Instructions Related Learning Outcomes: e
Also give me a step by step instructions on how to do it on Enterprise dynamics software as well
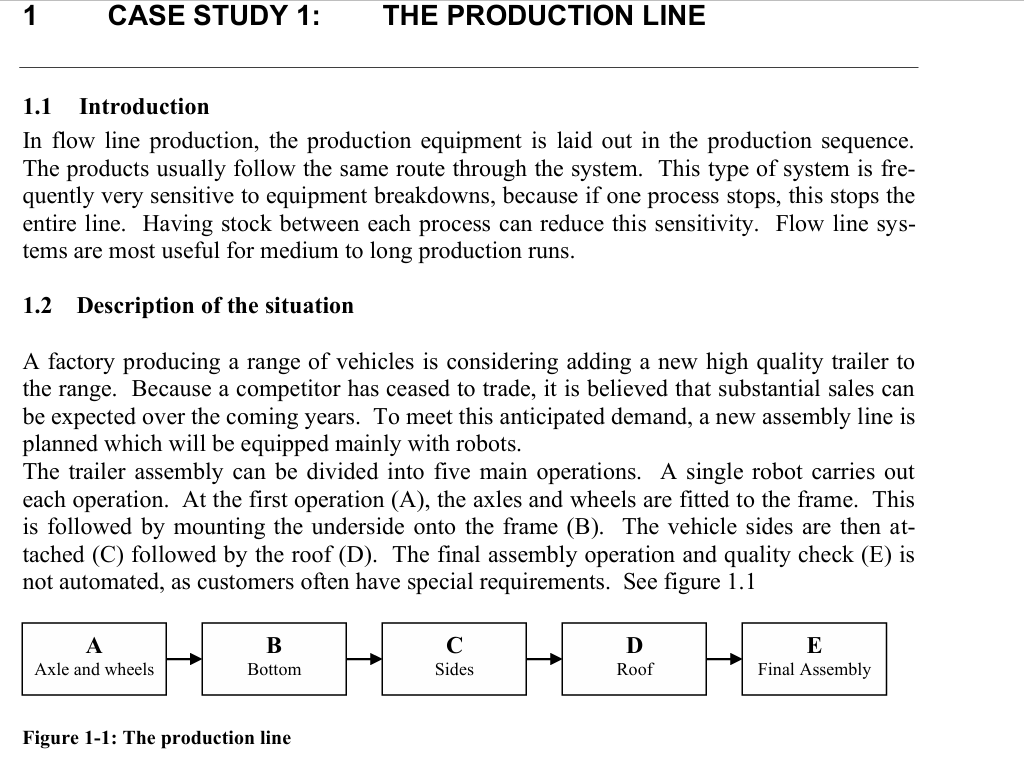
Assessment Instructions Related Learning Outcomes: e LO3: Produce a model that will be a useful tool for understanding real-world problems. e LO4: Create a simulation of a complex problem using suitable software. Task Overview: Using the case study provided, you are required to build three simulation models in Enterprise Dynamic simulation software: 1. Flowshop1.mod Base model to estimate and compare weekly capacity against your calculated estimation. 2. Flowshop2.mod Apply Strategy 1: Reduce the average repair time of the robots to 3 minutes. 3. Flowshop3.mod Apply Strategy 2: Add two buffer zones to the assembly line, each holding one trailer. You will run experiments for each model and provide a comparative analysis to recommend the most effective strategy based on sound logistics principles Last record a PowerPoint voice over reflective video that seek to address the following: e Key decisions in model design and simplification e Experiment setup and key results e Challenges faced and how they were addressed e Insights gained from comparing the three models How this exercise enhanced your understanding of modelling and simulation in practice 1 CASE STUDY 1: THE PRODUCTION LINE 1.1. Introduction In flow line production, the production equipment is laid out in the production sequence. The products usually follow the same route through the system. This type of system is fre- quently very sensitive to equipment breakdowns, because if one process stops, this stops the entire line. Having stock between each process can reduce this sensitivity. Flow line sys- tems are most useful for medium to long production runs. 1.2 Description of the situation A factory producing a range of vehicles is considering adding a new high quality trailer to the range. Because a competitor has ceased to trade, it is believed that substantial sales can be expected over the coming years. To meet this anticipated demand, a new assembly line is planned which will be equipped mainly with robots. The trailer assembly can be divided into five main operations. A single robot carries out each operation. At the first operation (A), the axles and wheels are fitted to the frame. This is followed by mounting the underside onto the frame (B). The vehicle sides are then at- tached (C) followed by the roof (D). The final assembly operation and quality check (E) is not automated, as customers often have special requirements. See figure 1.1 A B E Axle and wheels Bottom Final Assembly Figure 1-1: The production line All the parts used for the assembly are standard. There are several types of some parts, but these have no effect on the processing speed. Also, there is always an adequate stock of parts to supply the line. Although the first four processes are fully automated, it has not been possible to synchronize them precisely. Axle to frame assembly (A) takes an average of 15 minutes, as does attach- ing the underside to the frame (B). Assembling the sides to the frame (C) requires an aver- age of 18 minutes, and the roof assembly (D) is a precision process and only three trailers per hour can be completed. Final assembly and quality check (E) is a manual operation and take an average of 18 minutes. As mentioned above, the actual parts used at each stage does not affect the processes. The first four processes follow a uniform distribution with a range of 2 minutes, so a 15 minute process implies a range from 14 to 16 minutes. The processing time for the final operation follows a normal distribution with a standard deviation of 3 minutes. In the factory, the working day consists of 8 hours and 5 working days form one working week. Production starts every working day where the day before has ended. The robots are not completely trouble-free. The robot's supplier guarantees that the robots will get failures only once an hour (negative exponentially distributed and including repair time). Internal checks have kept the average repair time within reasonable bounds, and as a result this time seems to be exponentially distributed with an average of 6 minutes. The space available for the production line is very limited, and as a result the line can ac- commodate only five trailers. This means that there is no room for any buffer zones between the steps of the process. As each trailer is finished, it is moved to the storage yard. The management now wish to conclude contract negotiations with potential buyers, leading to long term commitments for quantities to be supplied. However, the capacity for the new line is unknown, and a realistic estimate of this on a weekly basis is required. 1.3. Assignments 1. | On the basis of the case study information, try to make an estimate for the capacity per week, and explain how you reach this conclusion. 2. Create a simulation model to determine the weekly production and make an experi- ment with a warm up period of one week and a measurement period of 10 weeks. Do your results correspond to your estimation? What is the cause of possible differences? (flowshop1.mod) 3. | The management wants to compare the following two strategies: Strategy | Reduction of the average repair time of the robots to 3 minutes (flowshop2.mod). Strategy 2 Extension of the assembly line by adding 2 buffer zones, each with enough space for one trailer (flowshop3.mod). NB: Several choices are possible; try to make the right choice according to logistics principles
Step by Step Solution
There are 3 Steps involved in it
1 Expert Approved Answer
Step: 1 Unlock
Question Has Been Solved by an Expert!
Get step-by-step solutions from verified subject matter experts
Step: 2 Unlock
Step: 3 Unlock
Students Have Also Explored These Related General Management Questions!