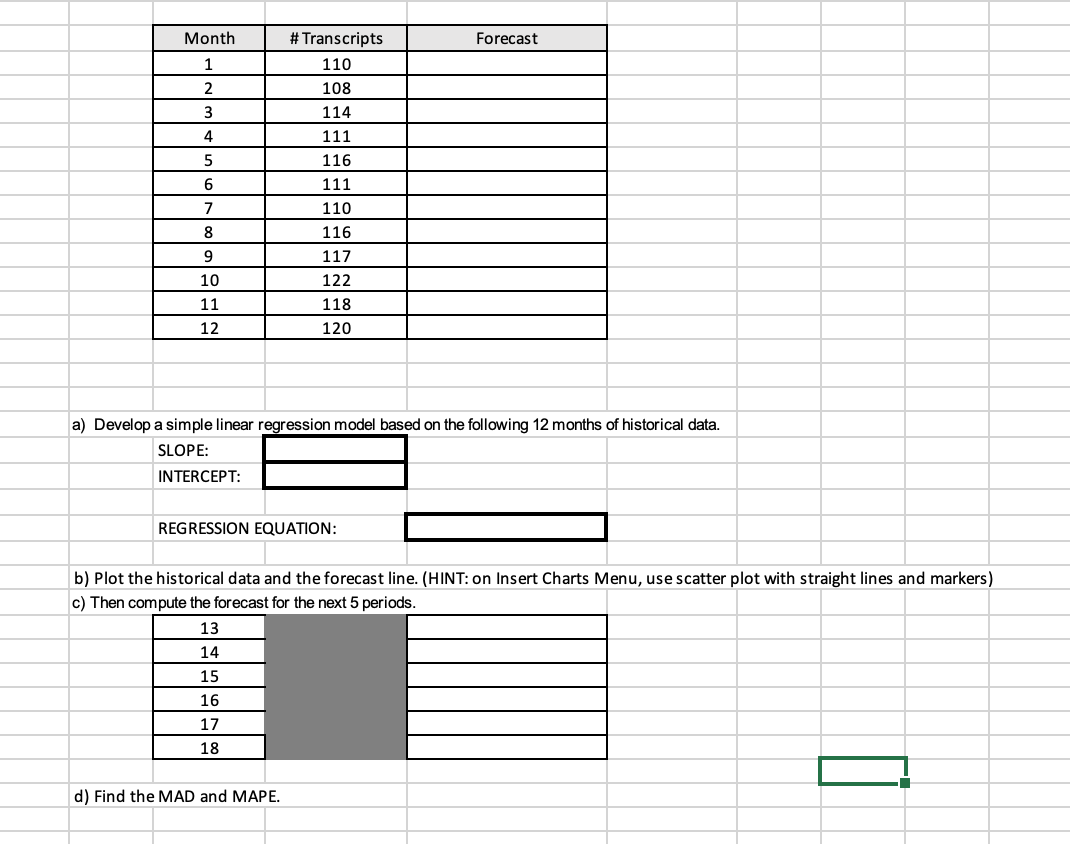
Question: Also need a graph. Forecast Month 1 2 3 4 5 6 7 # Transcripts 110 108 114 111 116 111 110 116 117 122

Also need a graph. Forecast Month 1 2 3 4 5 6 7 #Also need a graph.

Forecast Month 1 2 3 4 5 6 7 # Transcripts 110 108 114 111 116 111 110 116 117 122 118 120 8 9 10 11 12 a) Develop a simple linear regression model based on the following 12 months of historical data. SLOPE: INTERCEPT: REGRESSION EQUATION: b) Plot the historical data and the forecast line. (HINT: on Insert Charts Menu, use scatter plot with straight lines and markers) c) Then compute the forecast for the next 5 periods. 13 14 15 16 17 18 d) Find the MAD and MAPE

Step by Step Solution

There are 3 Steps involved in it

1 Expert Approved Answer
Step: 1 Unlock blur-text-image
Question Has Been Solved by an Expert!

Get step-by-step solutions from verified subject matter experts

Step: 2 Unlock
Step: 3 Unlock

Students Have Also Explored These Related General Management Questions!