

Question: Also Please Find the P-value ! ty that these data are normally distributed, using the sample mean x=0.0009665 with SD=0.0166. Complete parts a through e
Also Please Find the P-value ! ty
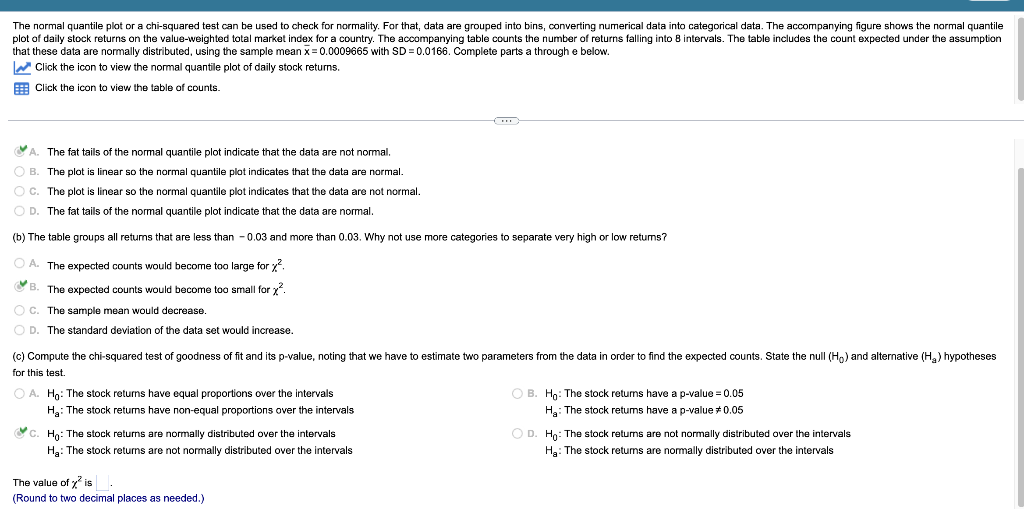
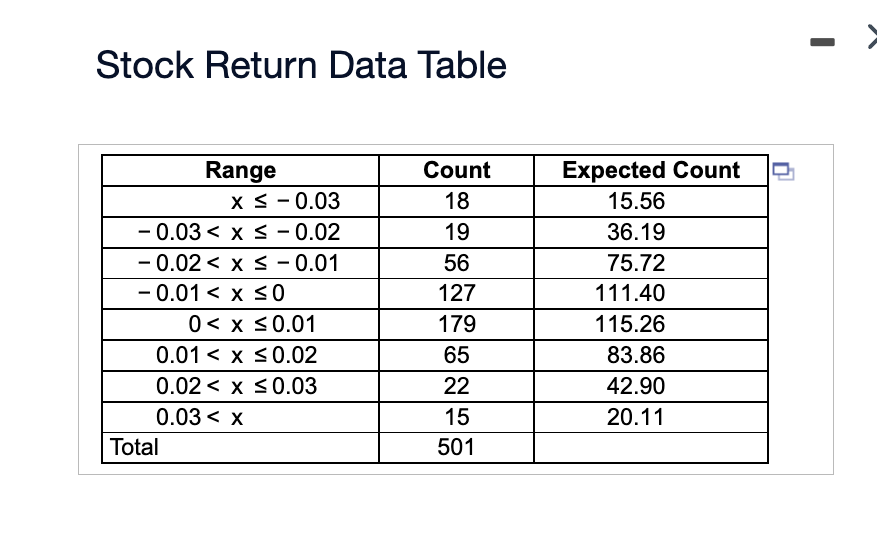
that these data are normally distributed, using the sample mean x=0.0009665 with SD=0.0166. Complete parts a through e below. Click the icon to view the normal quantile plot of daily stock returns. Click the icon to view the table of counts. A. The fat tails of the normal quantile plot indicate that the data are not normal. B. The plot is linear so the normal quantile plot indicates that the data are normal. C. The plot is linear so the normal quantile plot indicates that the data are not normal. D. The fat tails of the normal quantile plot indicate that the data are normal. (b) The table groups all retums that are less than 0.03 and more than 0.03. Why not use more categories to separate very high or low retums? A. The expected counts would become too large for 2. B. The expected counts would become too small for 2. C. The sample mean would decrease. D. The standard deviation of the data set would increase. for this test. A. H0 : The stock returns have equal proportions over the intervals B. H0 : The stock returns have a p-value =0.05 Ha : The stock returns have non-equal proportions over the intervals Ha : The stock retums have a p-value =0.05 C. H0 : The stock returns are normally distributed over the intervals D. H0 : The stock returns are not normally distributed over the intervals Ha : The stock returns are not normally distributed over the intervals Ha : The stock returns are normally distributed over the intervals The value of 2 is (Round to two decimal places as needed.) Stock Return Data Table
Step by Step Solution
There are 3 Steps involved in it

Get step-by-step solutions from verified subject matter experts