

Question: also, what formulas do i use to calculate the answer ? FED EX Corp. yahoo finance data 1 05/31/19 (year end) - 4 Current stock
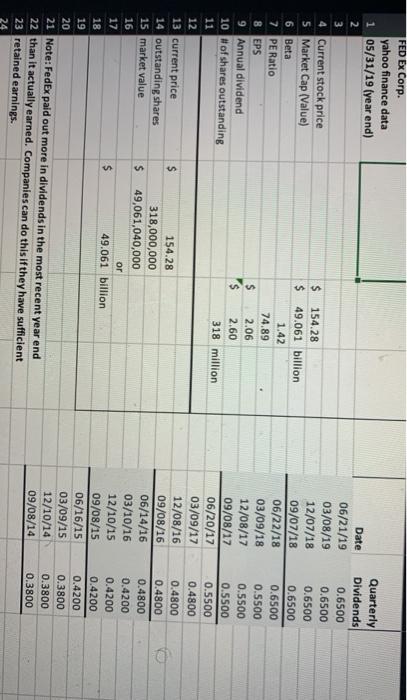
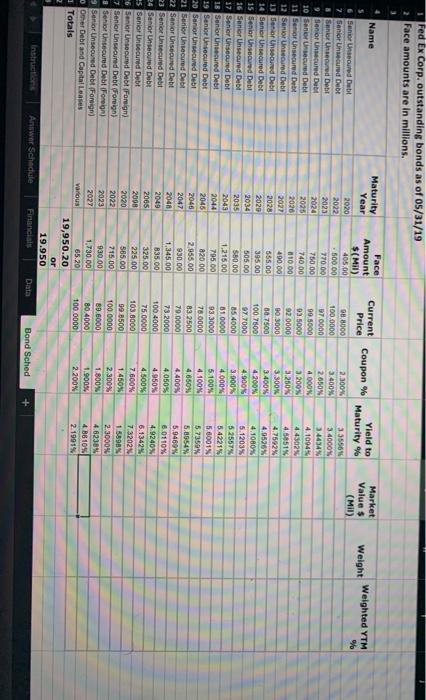
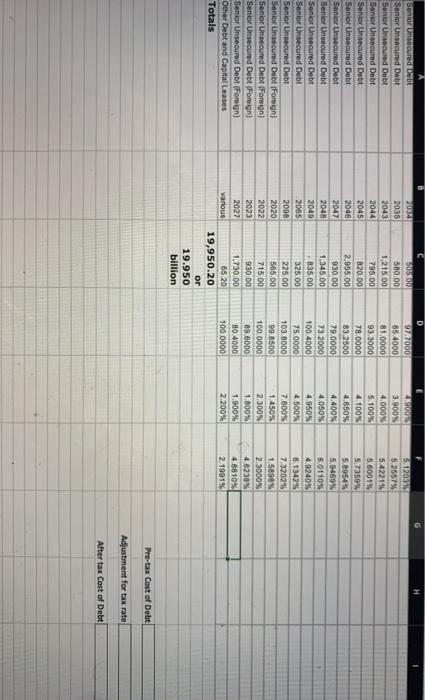
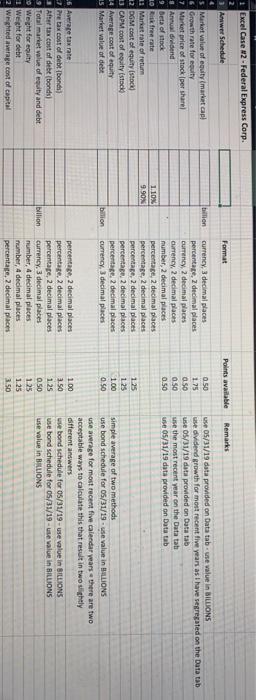
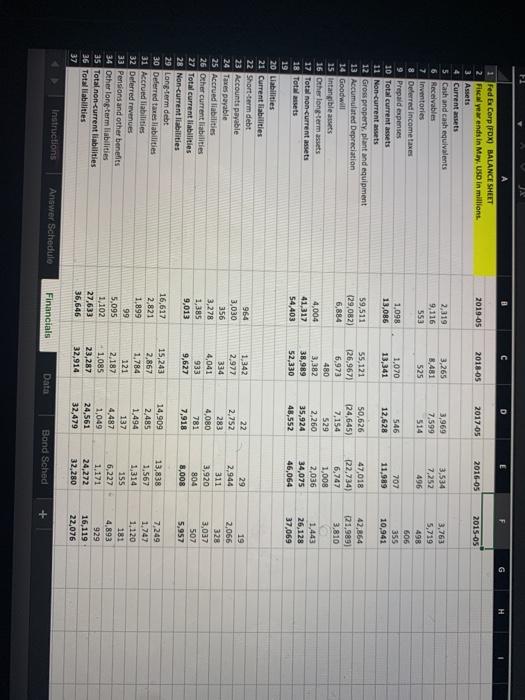
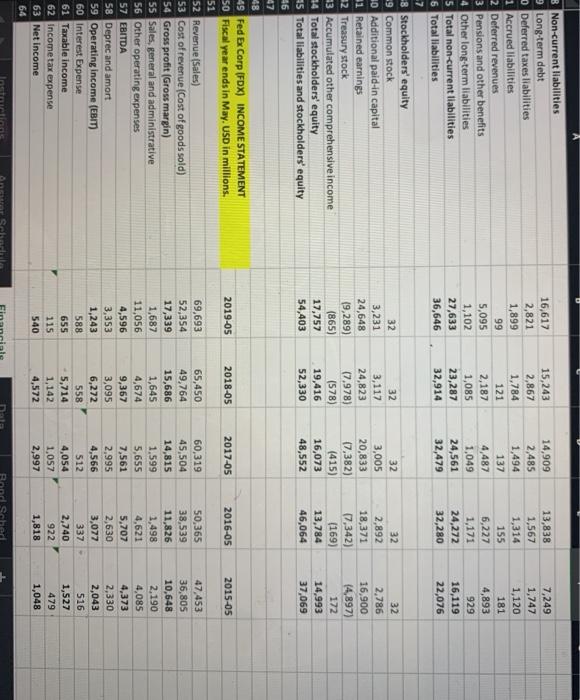
FED EX Corp. yahoo finance data 1 05/31/19 (year end) - 4 Current stock price $ 154.28 5 Market Cap (Value) $ 49.061 billion 6 Beta 1.42 7 PE Ratio 74.89 8 EPS $ 2.06 9 Annual dividend 2.60 10 # of shares outstanding 318 million 11 12 13 current price 154.28 14 outstanding shares 318,000,000 15 market value $ 49,061,040,000 16 or 17 49.061 billion 18 19 20 21 Note: FedEx paid out more in dividends in the most recent year end 22 than it actually earned. Companies can do this if they have sufficient 23 retained earnings 24 Date 06/21/19 03/08/19 12/07/18 09/07/18 06/22/18 03/09/18 12/08/17 09/08/17 06/20/17 03/09/17 12/08/16 09/08/16 06/14/16 03/10/16 12/10/15 09/08/15 06/16/15 03/09/15 12/10/14 09/08/14 Quarterly Dividends 0.6500 0.6500 0.6500 0.6500 0.6500 0.5500 0.5500 0.5500 0.5500 0.4800 0.4800 0.4800 0.4800 0.4200 0.4200 0.4200 0.4200 0.3800 0.3800 0.3800 Fed Ex Corp. outstanding bonds as of 05/31/19 Face amounts are in millions. Current Price Coupon % Yield to Maturity % Market Value $ (Mil) Weight Weighted YTM % Name Maturity Face Year Amount $(MI) 6 Senior Unsecured Debt 2020 405.00 7 Senior Unsecured Dube 2022 - 500.00 Senior Unsere Debt 2023 770.00 9 Senior Unsecured Dube 2024 750.00 10 Sanier unsecured Debt 2025 740.00 11 Senior Unsecured Debt 2020 10.00 12 Senior Unsecured Debt 2027 400.00 13 Senior Unsecured Debt 2028 555.00 14 Senior Unoured Debt 2020 395.00 15 Senior Unsecured Debt 2034 505.00 16 Senior Unsecured Debt 2035 $50.00 17 Senior Unsecured Debt 2049 1.215.00 18 Senior Unsecured Debt 2044 795.00 19 Senior Unsecured Debt 2045 820.00 20 Senior Unsecured Debt 2046 2,055.00 21 Senior Unsecured Debt 2047 930.00 22 Senior Unsecured Debt 2046 1.345.00 23 Senior Unsecured Debt 2049 B35.00 24 Senior Unsecured Debt 2005 325.00 Es Senior Unsecured Debt 2098 225.00 6 Senior Unsecured Debt Fonsign) 2020 585.00 Senior Unsecured Debt Foreign 2022 715.00 Senior Unsecured Debt Foreign 2023 930.00 Senior Unsecured Debt (Foreign 2027 1.730.00 Omer Debt and Capital Leases Various 65.20 Totals 19,950.20 or 19.950 Instructions Answer Schedule Financial 08.8000 100.0000 97.0000 99 5000 93 5000 92 0000 90.3000 80 7500 100 7500 97.7000 85.4000 81,0000 93.3000 78.0000 83 2500 79.0000 73.2000 100.4000 75.0000 103.0000 99 8500 100 0000 89.6000 80 4000 100 0000 2.300% 3.400% 2.650% 4 000 3.2005 3.250% 3.300% 3.400% 4 200% 4.900 3.900 4.000% 5.100% 4.100% 4.6505 4400 4.050% 4.950% 4 500% 7.600% 1.4505 2.300% 1.800% 1.9005 2.200 3355616 3.4000% 3.4434% 4.10945 44302 4.5651 4.7582% 4.9526% 4.1080% 5.1203% 5.2557% 5.4221% 5.6001% 5.7359 5.8054% 5.9460 6.0110% 4.9240% 6.1342 73202 1.5898 2.3000% 4.62305 48610% 2.1991% Bond Sched + SONOUSO CUTE Senior Unsecured Debt Senior Unsecured Debt Senior Unsecured Debt Senior Unsecured Debt Senior Unsecured Debt Senior Unsecured Debt Senior Unsecured Debt Senior Unsecured Debt Senior Unsecured Debt Senior Unsecured Debt Senior Unsecured Debt (Foreign) Senior Unsecured Debt (Foreign) Senior Unsecured Debt (Foreign) Senior Unsecured Debt (Foreign) Other Debt and Capital Leases Totals 2035 2043 2044 2045 2046 2047 2048 2049 2055 2098 2020 2022 2023 2027 various 50500 580.00 1.215.00 795 00 820.00 2.955.00 930.00 1,345.00 835,00 325.00 225,00 565,00 715,00 930.00 1.730.00 65.20 19,950.20 or 19.950 billion D 9727000 85.4000 B1.0000 93.3000 78.0000 83.2500 79.0000 73 2000 100 4000 75 0000 103.8000 99.8500 100.0000 89.6000 80.4000 100 0000 3.900% 4.000% 5. 100% 4.100% 4.650% 4.400% 4.050% 4950% 4 500% 7.600% 1.450% 2.300% 1.800% 1.900% 2.200% 551203 5.2557% 5.4221% 5.6001% 5.7359% 5.8954% 5,9469% 5.0110 4 92404% 8.13423 7.3202% 1.5898% 2.3000% 4.6238% 4.8610% 2.1991% Pre-tax Cost of Debt Adjustment for tax rate After tax Cost of Debt Excel Case N2 - Federal Express Corp. Format Anwer Schedule Remarks Pois available bilion 0.50 175 0.50 0.50 0.50 use 05/31/19 data provided on Data tabuse value in BILLIONS use dividend growth for most recent five years as I have segregated on the Data tab use 05/31/19 data provided on Data tab use the most recent year on the Data ta use 05/31/19 data provided on Data tab Market value of equitymarket cap 6 Growth rate for oily 7 Market price of stock per share Annual didend 9 beta of tack 10 Riik free rate Manate of return 12 DGM cost of equity stock CAPM cost of equity (stock) 24 Average cost of equity 15 Market value of debt 1.10% 9.90 currency, 3 decimal places percentate decimal places curreny, 2 decimal places Currency, 2 decimal places number, 2 decimal places percentage 2 decimal places percentage, 2 decimal places percentage, 2 decimal places percentage 2 decimal places percentage 2 decimal places Currency, 3 decimal places 1.25 125 1.00 0.50 billion simple average of two methods use bond schedule for 05/31/19 .use value in BILLIONS use average for most recent five calendar years there are two acceptable ways to calculate this that result in two sightly different awers use bond schedule for 05/31/19-use value in BILLIONS use bond schedule for 05/31/19-se value in BILLIONS use value in BILLIONS - Average tax rate Pretax cost of debt bonds) After tax cost of debt (bonds) 9 Total market value of evity and debt Weight for equity 1 Weight for det 2 Wrighted average cost of capital billion percentage, 2 decimal places percenta. 2 decimal places percentage, 2 decimal places Currency, 3 decimal places number, 4 decimal places number, 4 decimal places percentate 2 decimal places 1.00 3.50 125 0.50 1.25 1.25 3.50 D G H 2019-05 2018-05 2017-05 2016-05 2015-05 2,319 9,116 553 3,265 8,481 525 3,969 7,599 514 3,534 7,252 496 3,763 5,719 498 606 355 10,941 1,098 13,086 1.070 13,341 546 12,628 707 11,989 59,511 129,082) 6,884 42,864 (21,989) 3.810 55,121 (26,9671 6,973 480 3,382 38,989 52,330 50,626 124,645) 7,154 529 2,260 35,924 48,552 47,018 (22,734) 6,747 1,008 2,036 34,075 46,064 4,004 41,317 54,403 FedEx Corp (FDX) BALANCE SHEET Fiscal year ends in May. USD in millions 3 Assets 4 Current assets 5 Cash and cash equivalents 6 Receivables 7 Inventories 8 Deferred income taxes 9 Prepaid expenses 10 Total current assets 11 Non-current assets 12 Gross property, plant and equipment 13 Accumulated Depreciation 14 Goodwill 15 Intangible assets 16 other long-term assets 17 Tot non-current assets 18 Total assets 19 20 Liabilities 21 Current liabilities 22 Short-term debt 23 Accounts payable 24 Taxes payable 25 Accrued liabilities 26 Other current liabilities 27 Total current liabilities 28 Non-current liabilities 29 Long-term debt 30 Deferred taxes liabilities 31 Accrued liabilities 32 Deferred revenues 33 Pensions and other benefits 34 Other long-term liabilities 35 Total non-current liabilities 36 Total liabilities 37 1,443 26,128 37,069 964 3,030 356 3,278 1,385 9,013 1,342 2,977 334 4,041 933 9,627 22 2,752 283 4,080 781 7,918 29 2,944 311 3,920 804 8,008 19 2,066 328 3,037 507 5,957 16,617 2,821 1,899 99 5,095 1,102 27,633 36,646 15,243 2,867 1,784 121 2.187 1,085 23,287 32,914 14,909 2,485 1.494 137 4,487 1,049 24,561 32,479 13,838 1.567 1,314 155 6,227 1,171 24,272 32,280 7,249 1.747 1120 181 4,893 929 16,119 22,076 Instructions Answer Schedule Financials Data Bond Sched + B Non-current liabilities Long-term debt Deferred taxes liabilities 1 Accrued liabilities 2 Deferred revenues 3 Pensions and other benefits 4 Other long-term liabilities 5 Total non-current liabilities 6 Total liabilities 16,617 2,821 1,899 99 5,095 1,102 27,633 36,646 15,243 2,867 1,784 121 2,187 1,085 23,287 32,914 14,909 2,485 1,494 137 4,487 1.049 24,561 32,479 13,838 1,567 1,314 155 6,227 1,171 24,272 32,280 7,249 1,747 1,120 181 4,893 929 16,119 22,076 32 3,231 24,648 (9,289) (865) 17,757 54,403 32 3,117 24,823 (7,978) (578) 19,416 52,330 32 3,005 20,833 17,382) (415) 16,073 48,552 32 2,892 18,371 (7,342) (169) 13,784 46,064 32 2,786 16,900 (4,897) 172 14,993 37,069 2019-05 2018-05 2017-05 2016-05 2015-05 8 Stockholders' equity 9 Common stock 20 Additional paid-in capital 1 Retained earnings 32 Treasury stock 13 Accumulated other comprehensive income 4 Total stockholders' equity 5 Total liabilities and stockholders' equity $6 47 48 49 fed ex Corp (FDX) INCOME STATEMENT 50 Fiscal year ends in May. USD in millions 51 52 Revenue (Sales) 53 Cost of revenue (Cost of goods sold) 54 Gross profit (Gross margin) 55 Sales, general and administrative 56 Other operating expenses 57 EBITDA 58 Deprec and amort 59 Operating income (EBIT) 60 Interest Expense 61 Taxable income 62 Income tax expense 63 Net Income 64 69,693 52,354 17,339 1,687 11,056 4,596 3,353 1,243 588 655 115 540 65,450 49,764 15,686 1,645 4,674 9,367 3,095 6,272 558 5,714 1,142 4,572 60,319 45,504 14,815 1,599 5,655 7,561 2,995 4,566 512 4,054 1,057 2,997 50,365 38,539 11,826 1,498 4,621 5,707 2,630 3,077 337- 2,740 922 1,818 47,453 36,805 10,648 2.190 4,085 4,373 2,330 2,043 516 1,527 479 1,048 FED EX Corp. yahoo finance data 1 05/31/19 (year end) - 4 Current stock price $ 154.28 5 Market Cap (Value) $ 49.061 billion 6 Beta 1.42 7 PE Ratio 74.89 8 EPS $ 2.06 9 Annual dividend 2.60 10 # of shares outstanding 318 million 11 12 13 current price 154.28 14 outstanding shares 318,000,000 15 market value $ 49,061,040,000 16 or 17 49.061 billion 18 19 20 21 Note: FedEx paid out more in dividends in the most recent year end 22 than it actually earned. Companies can do this if they have sufficient 23 retained earnings 24 Date 06/21/19 03/08/19 12/07/18 09/07/18 06/22/18 03/09/18 12/08/17 09/08/17 06/20/17 03/09/17 12/08/16 09/08/16 06/14/16 03/10/16 12/10/15 09/08/15 06/16/15 03/09/15 12/10/14 09/08/14 Quarterly Dividends 0.6500 0.6500 0.6500 0.6500 0.6500 0.5500 0.5500 0.5500 0.5500 0.4800 0.4800 0.4800 0.4800 0.4200 0.4200 0.4200 0.4200 0.3800 0.3800 0.3800 Fed Ex Corp. outstanding bonds as of 05/31/19 Face amounts are in millions. Current Price Coupon % Yield to Maturity % Market Value $ (Mil) Weight Weighted YTM % Name Maturity Face Year Amount $(MI) 6 Senior Unsecured Debt 2020 405.00 7 Senior Unsecured Dube 2022 - 500.00 Senior Unsere Debt 2023 770.00 9 Senior Unsecured Dube 2024 750.00 10 Sanier unsecured Debt 2025 740.00 11 Senior Unsecured Debt 2020 10.00 12 Senior Unsecured Debt 2027 400.00 13 Senior Unsecured Debt 2028 555.00 14 Senior Unoured Debt 2020 395.00 15 Senior Unsecured Debt 2034 505.00 16 Senior Unsecured Debt 2035 $50.00 17 Senior Unsecured Debt 2049 1.215.00 18 Senior Unsecured Debt 2044 795.00 19 Senior Unsecured Debt 2045 820.00 20 Senior Unsecured Debt 2046 2,055.00 21 Senior Unsecured Debt 2047 930.00 22 Senior Unsecured Debt 2046 1.345.00 23 Senior Unsecured Debt 2049 B35.00 24 Senior Unsecured Debt 2005 325.00 Es Senior Unsecured Debt 2098 225.00 6 Senior Unsecured Debt Fonsign) 2020 585.00 Senior Unsecured Debt Foreign 2022 715.00 Senior Unsecured Debt Foreign 2023 930.00 Senior Unsecured Debt (Foreign 2027 1.730.00 Omer Debt and Capital Leases Various 65.20 Totals 19,950.20 or 19.950 Instructions Answer Schedule Financial 08.8000 100.0000 97.0000 99 5000 93 5000 92 0000 90.3000 80 7500 100 7500 97.7000 85.4000 81,0000 93.3000 78.0000 83 2500 79.0000 73.2000 100.4000 75.0000 103.0000 99 8500 100 0000 89.6000 80 4000 100 0000 2.300% 3.400% 2.650% 4 000 3.2005 3.250% 3.300% 3.400% 4 200% 4.900 3.900 4.000% 5.100% 4.100% 4.6505 4400 4.050% 4.950% 4 500% 7.600% 1.4505 2.300% 1.800% 1.9005 2.200 3355616 3.4000% 3.4434% 4.10945 44302 4.5651 4.7582% 4.9526% 4.1080% 5.1203% 5.2557% 5.4221% 5.6001% 5.7359 5.8054% 5.9460 6.0110% 4.9240% 6.1342 73202 1.5898 2.3000% 4.62305 48610% 2.1991% Bond Sched + SONOUSO CUTE Senior Unsecured Debt Senior Unsecured Debt Senior Unsecured Debt Senior Unsecured Debt Senior Unsecured Debt Senior Unsecured Debt Senior Unsecured Debt Senior Unsecured Debt Senior Unsecured Debt Senior Unsecured Debt Senior Unsecured Debt (Foreign) Senior Unsecured Debt (Foreign) Senior Unsecured Debt (Foreign) Senior Unsecured Debt (Foreign) Other Debt and Capital Leases Totals 2035 2043 2044 2045 2046 2047 2048 2049 2055 2098 2020 2022 2023 2027 various 50500 580.00 1.215.00 795 00 820.00 2.955.00 930.00 1,345.00 835,00 325.00 225,00 565,00 715,00 930.00 1.730.00 65.20 19,950.20 or 19.950 billion D 9727000 85.4000 B1.0000 93.3000 78.0000 83.2500 79.0000 73 2000 100 4000 75 0000 103.8000 99.8500 100.0000 89.6000 80.4000 100 0000 3.900% 4.000% 5. 100% 4.100% 4.650% 4.400% 4.050% 4950% 4 500% 7.600% 1.450% 2.300% 1.800% 1.900% 2.200% 551203 5.2557% 5.4221% 5.6001% 5.7359% 5.8954% 5,9469% 5.0110 4 92404% 8.13423 7.3202% 1.5898% 2.3000% 4.6238% 4.8610% 2.1991% Pre-tax Cost of Debt Adjustment for tax rate After tax Cost of Debt Excel Case N2 - Federal Express Corp. Format Anwer Schedule Remarks Pois available bilion 0.50 175 0.50 0.50 0.50 use 05/31/19 data provided on Data tabuse value in BILLIONS use dividend growth for most recent five years as I have segregated on the Data tab use 05/31/19 data provided on Data tab use the most recent year on the Data ta use 05/31/19 data provided on Data tab Market value of equitymarket cap 6 Growth rate for oily 7 Market price of stock per share Annual didend 9 beta of tack 10 Riik free rate Manate of return 12 DGM cost of equity stock CAPM cost of equity (stock) 24 Average cost of equity 15 Market value of debt 1.10% 9.90 currency, 3 decimal places percentate decimal places curreny, 2 decimal places Currency, 2 decimal places number, 2 decimal places percentage 2 decimal places percentage, 2 decimal places percentage, 2 decimal places percentage 2 decimal places percentage 2 decimal places Currency, 3 decimal places 1.25 125 1.00 0.50 billion simple average of two methods use bond schedule for 05/31/19 .use value in BILLIONS use average for most recent five calendar years there are two acceptable ways to calculate this that result in two sightly different awers use bond schedule for 05/31/19-use value in BILLIONS use bond schedule for 05/31/19-se value in BILLIONS use value in BILLIONS - Average tax rate Pretax cost of debt bonds) After tax cost of debt (bonds) 9 Total market value of evity and debt Weight for equity 1 Weight for det 2 Wrighted average cost of capital billion percentage, 2 decimal places percenta. 2 decimal places percentage, 2 decimal places Currency, 3 decimal places number, 4 decimal places number, 4 decimal places percentate 2 decimal places 1.00 3.50 125 0.50 1.25 1.25 3.50 D G H 2019-05 2018-05 2017-05 2016-05 2015-05 2,319 9,116 553 3,265 8,481 525 3,969 7,599 514 3,534 7,252 496 3,763 5,719 498 606 355 10,941 1,098 13,086 1.070 13,341 546 12,628 707 11,989 59,511 129,082) 6,884 42,864 (21,989) 3.810 55,121 (26,9671 6,973 480 3,382 38,989 52,330 50,626 124,645) 7,154 529 2,260 35,924 48,552 47,018 (22,734) 6,747 1,008 2,036 34,075 46,064 4,004 41,317 54,403 FedEx Corp (FDX) BALANCE SHEET Fiscal year ends in May. USD in millions 3 Assets 4 Current assets 5 Cash and cash equivalents 6 Receivables 7 Inventories 8 Deferred income taxes 9 Prepaid expenses 10 Total current assets 11 Non-current assets 12 Gross property, plant and equipment 13 Accumulated Depreciation 14 Goodwill 15 Intangible assets 16 other long-term assets 17 Tot non-current assets 18 Total assets 19 20 Liabilities 21 Current liabilities 22 Short-term debt 23 Accounts payable 24 Taxes payable 25 Accrued liabilities 26 Other current liabilities 27 Total current liabilities 28 Non-current liabilities 29 Long-term debt 30 Deferred taxes liabilities 31 Accrued liabilities 32 Deferred revenues 33 Pensions and other benefits 34 Other long-term liabilities 35 Total non-current liabilities 36 Total liabilities 37 1,443 26,128 37,069 964 3,030 356 3,278 1,385 9,013 1,342 2,977 334 4,041 933 9,627 22 2,752 283 4,080 781 7,918 29 2,944 311 3,920 804 8,008 19 2,066 328 3,037 507 5,957 16,617 2,821 1,899 99 5,095 1,102 27,633 36,646 15,243 2,867 1,784 121 2.187 1,085 23,287 32,914 14,909 2,485 1.494 137 4,487 1,049 24,561 32,479 13,838 1.567 1,314 155 6,227 1,171 24,272 32,280 7,249 1.747 1120 181 4,893 929 16,119 22,076 Instructions Answer Schedule Financials Data Bond Sched + B Non-current liabilities Long-term debt Deferred taxes liabilities 1 Accrued liabilities 2 Deferred revenues 3 Pensions and other benefits 4 Other long-term liabilities 5 Total non-current liabilities 6 Total liabilities 16,617 2,821 1,899 99 5,095 1,102 27,633 36,646 15,243 2,867 1,784 121 2,187 1,085 23,287 32,914 14,909 2,485 1,494 137 4,487 1.049 24,561 32,479 13,838 1,567 1,314 155 6,227 1,171 24,272 32,280 7,249 1,747 1,120 181 4,893 929 16,119 22,076 32 3,231 24,648 (9,289) (865) 17,757 54,403 32 3,117 24,823 (7,978) (578) 19,416 52,330 32 3,005 20,833 17,382) (415) 16,073 48,552 32 2,892 18,371 (7,342) (169) 13,784 46,064 32 2,786 16,900 (4,897) 172 14,993 37,069 2019-05 2018-05 2017-05 2016-05 2015-05 8 Stockholders' equity 9 Common stock 20 Additional paid-in capital 1 Retained earnings 32 Treasury stock 13 Accumulated other comprehensive income 4 Total stockholders' equity 5 Total liabilities and stockholders' equity $6 47 48 49 fed ex Corp (FDX) INCOME STATEMENT 50 Fiscal year ends in May. USD in millions 51 52 Revenue (Sales) 53 Cost of revenue (Cost of goods sold) 54 Gross profit (Gross margin) 55 Sales, general and administrative 56 Other operating expenses 57 EBITDA 58 Deprec and amort 59 Operating income (EBIT) 60 Interest Expense 61 Taxable income 62 Income tax expense 63 Net Income 64 69,693 52,354 17,339 1,687 11,056 4,596 3,353 1,243 588 655 115 540 65,450 49,764 15,686 1,645 4,674 9,367 3,095 6,272 558 5,714 1,142 4,572 60,319 45,504 14,815 1,599 5,655 7,561 2,995 4,566 512 4,054 1,057 2,997 50,365 38,539 11,826 1,498 4,621 5,707 2,630 3,077 337- 2,740 922 1,818 47,453 36,805 10,648 2.190 4,085 4,373 2,330 2,043 516 1,527 479 1,048
Step by Step Solution
There are 3 Steps involved in it

Get step-by-step solutions from verified subject matter experts