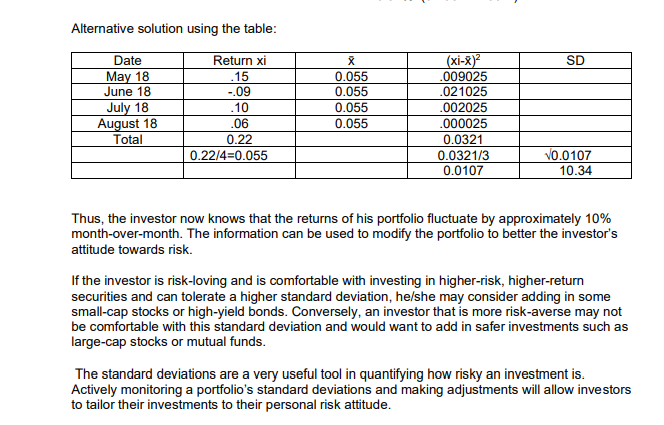
Question: Alternative solution using the table: Date Return xi X (xi-x)2 SD May 18 15 0.055 009025 June 18 -.09 0.055 021025 July 18 10 0.055

Alternative solution using the table: Date ReturnAlternative solution using the table: Date ReturnAlternative solution using the table: Date ReturnAlternative solution using the table: Date ReturnAlternative solution using the table: Date Return
Alternative solution using the table: Date Return xi X (xi-x)2 SD May 18 15 0.055 009025 June 18 -.09 0.055 021025 July 18 10 0.055 002025 August 18 06 0.055 000025 Total 0.22 0.0321 0.22/4=0.055 0.0321/3 10.0107 0.0107 10.34 Thus, the investor now knows that the returns of his portfolio fluctuate by approximately 10% month-over-month. The information can be used to modify the portfolio to better the investor's attitude towards risk. If the investor is risk-loving and is comfortable with investing in higher-risk, higher-return securities and can tolerate a higher standard deviation, he/she may consider adding in some small-cap stocks or high-yield bonds. Conversely, an investor that is more risk-averse may not be comfortable with this standard deviation and would want to add in safer investments such as large-cap stocks or mutual funds. The standard deviations are a very useful tool in quantifying how risky an investment is. Actively monitoring a portfolio's standard deviations and making adjustments will allow investors to tailor their investments to their personal risk attitude.Standard deviation- is a measure of the risk that an investment will fluctuate from its expected return. The smaller an investment's standard deviation, the less volatile it is. The larger the standard deviation, the more dispersed those returns are and thus the riskier the investment is. Note: TOTAL RISK (o) = Systematic Risk + Nonsystematic Risk > The components of the o formula: xi - return (stock price current divide by stock price previous less 1) * - average of returns n - no. of data points > In getting an estimate of the non-systematic risk, the total risk will be computed first then from this, the systematic risk will be deducted. Note that formula for return should be: stock price current divided by stock price previous less 1 > n-1 is used as divisor because only a sample of data is used. While total risk can be broken down to systematic and non-systematic risk, the breakdown formula is beyond the scope or coverage of this course. The Standard Deviation calculation steps are as follows: Calculate the average (mean) price for the number of periods or observations. 2. Determine each period's deviation (close less average price). 3. Square each period's deviation. 4. Sum the squared deviations. 5. Divide this sum by the number of observations. 6. The standard deviation is then equal to the square root of that number. ActivateStandard Deviation Example An investor wants to calculate the standard deviation experience by his investment portfolio in the last four months. Below are some historical return figures: Month Return May-18 15% Jun-18 -9% Jul-18 10% Aug-18 6% The first step is to calculate Rave, which is the arithmetic mean: (0.15 - 0.09 + 0.10 + 0.06) = 0.055 The arithmetic mean of returns is 5.5%. (0.055 x 100%) 6 Next, we can input the numbers into the formula as follows: (0.35-0.065)3+ (-0.09-0.055)2+ (0.10-0.055)- + (0.06 -0.055)= Activ =0.1034 Go to SDirection: Compute the standard deviation of the returns of the following stock for the year 2014. AC Year Stock Price Return xi (xi-8)2 30/1/2014 524.00 28/2/2014 575.50 31/3/2014 578.00 30/4/2014 624.00 30/5/2014 618.00 30/6/2014 647.50 31/7/2014 658.00 29/8/2014 700.50 30/9/2014 740.00 31/10/2014 690.00 28/11/2014 694.00 29/12/2014 694.00 TOTAL SDB. DIVERSIFICATION To minimize investment risk, an investor has to have a diversified portfolio. The composition of the portfolio depends on the risk appetite of the investor. A more conservative investor (i.e. investor who has less appetite for risk) may have a portfolio which is more skewed to fixed income instruments like time deposits. On the other hand, an investor who has a higher appetite for risk (i.e. an investor who is more willing to take risk) may have a portfolio which is more skewed to equity investments. Diversification - is a risk management technique that combines a wide variety of investments within a portfolio to reduce risk. A well diversified portfolio can eliminate non- systematic risk. One of the key concepts in portfolio management is the wisdom of diversification-which simply means not to put all your eggs in one basket. Diversification tries to reduce risk by allocating investments among various financial instruments, industries, and other categories. It aims to maximize retums by investing in different areas that would each react differently to the same event. There are many ways to diversify. How you choose to do it is up to you. Your goals for the future, your appetite for risk, and your personality are all factors in deciding how to build your portfolio. Aunt Allocation for a Conservative Portfolio Short-Torre

Step by Step Solution

There are 3 Steps involved in it

1 Expert Approved Answer
Step: 1 Unlock blur-text-image
Question Has Been Solved by an Expert!

Get step-by-step solutions from verified subject matter experts

Step: 2 Unlock
Step: 3 Unlock

Students Have Also Explored These Related Accounting Questions!