

Question: AMAT 120 - Project - Pressure Drop Instructions Complete a report that is responsive to each of the items below. Your report should show enough


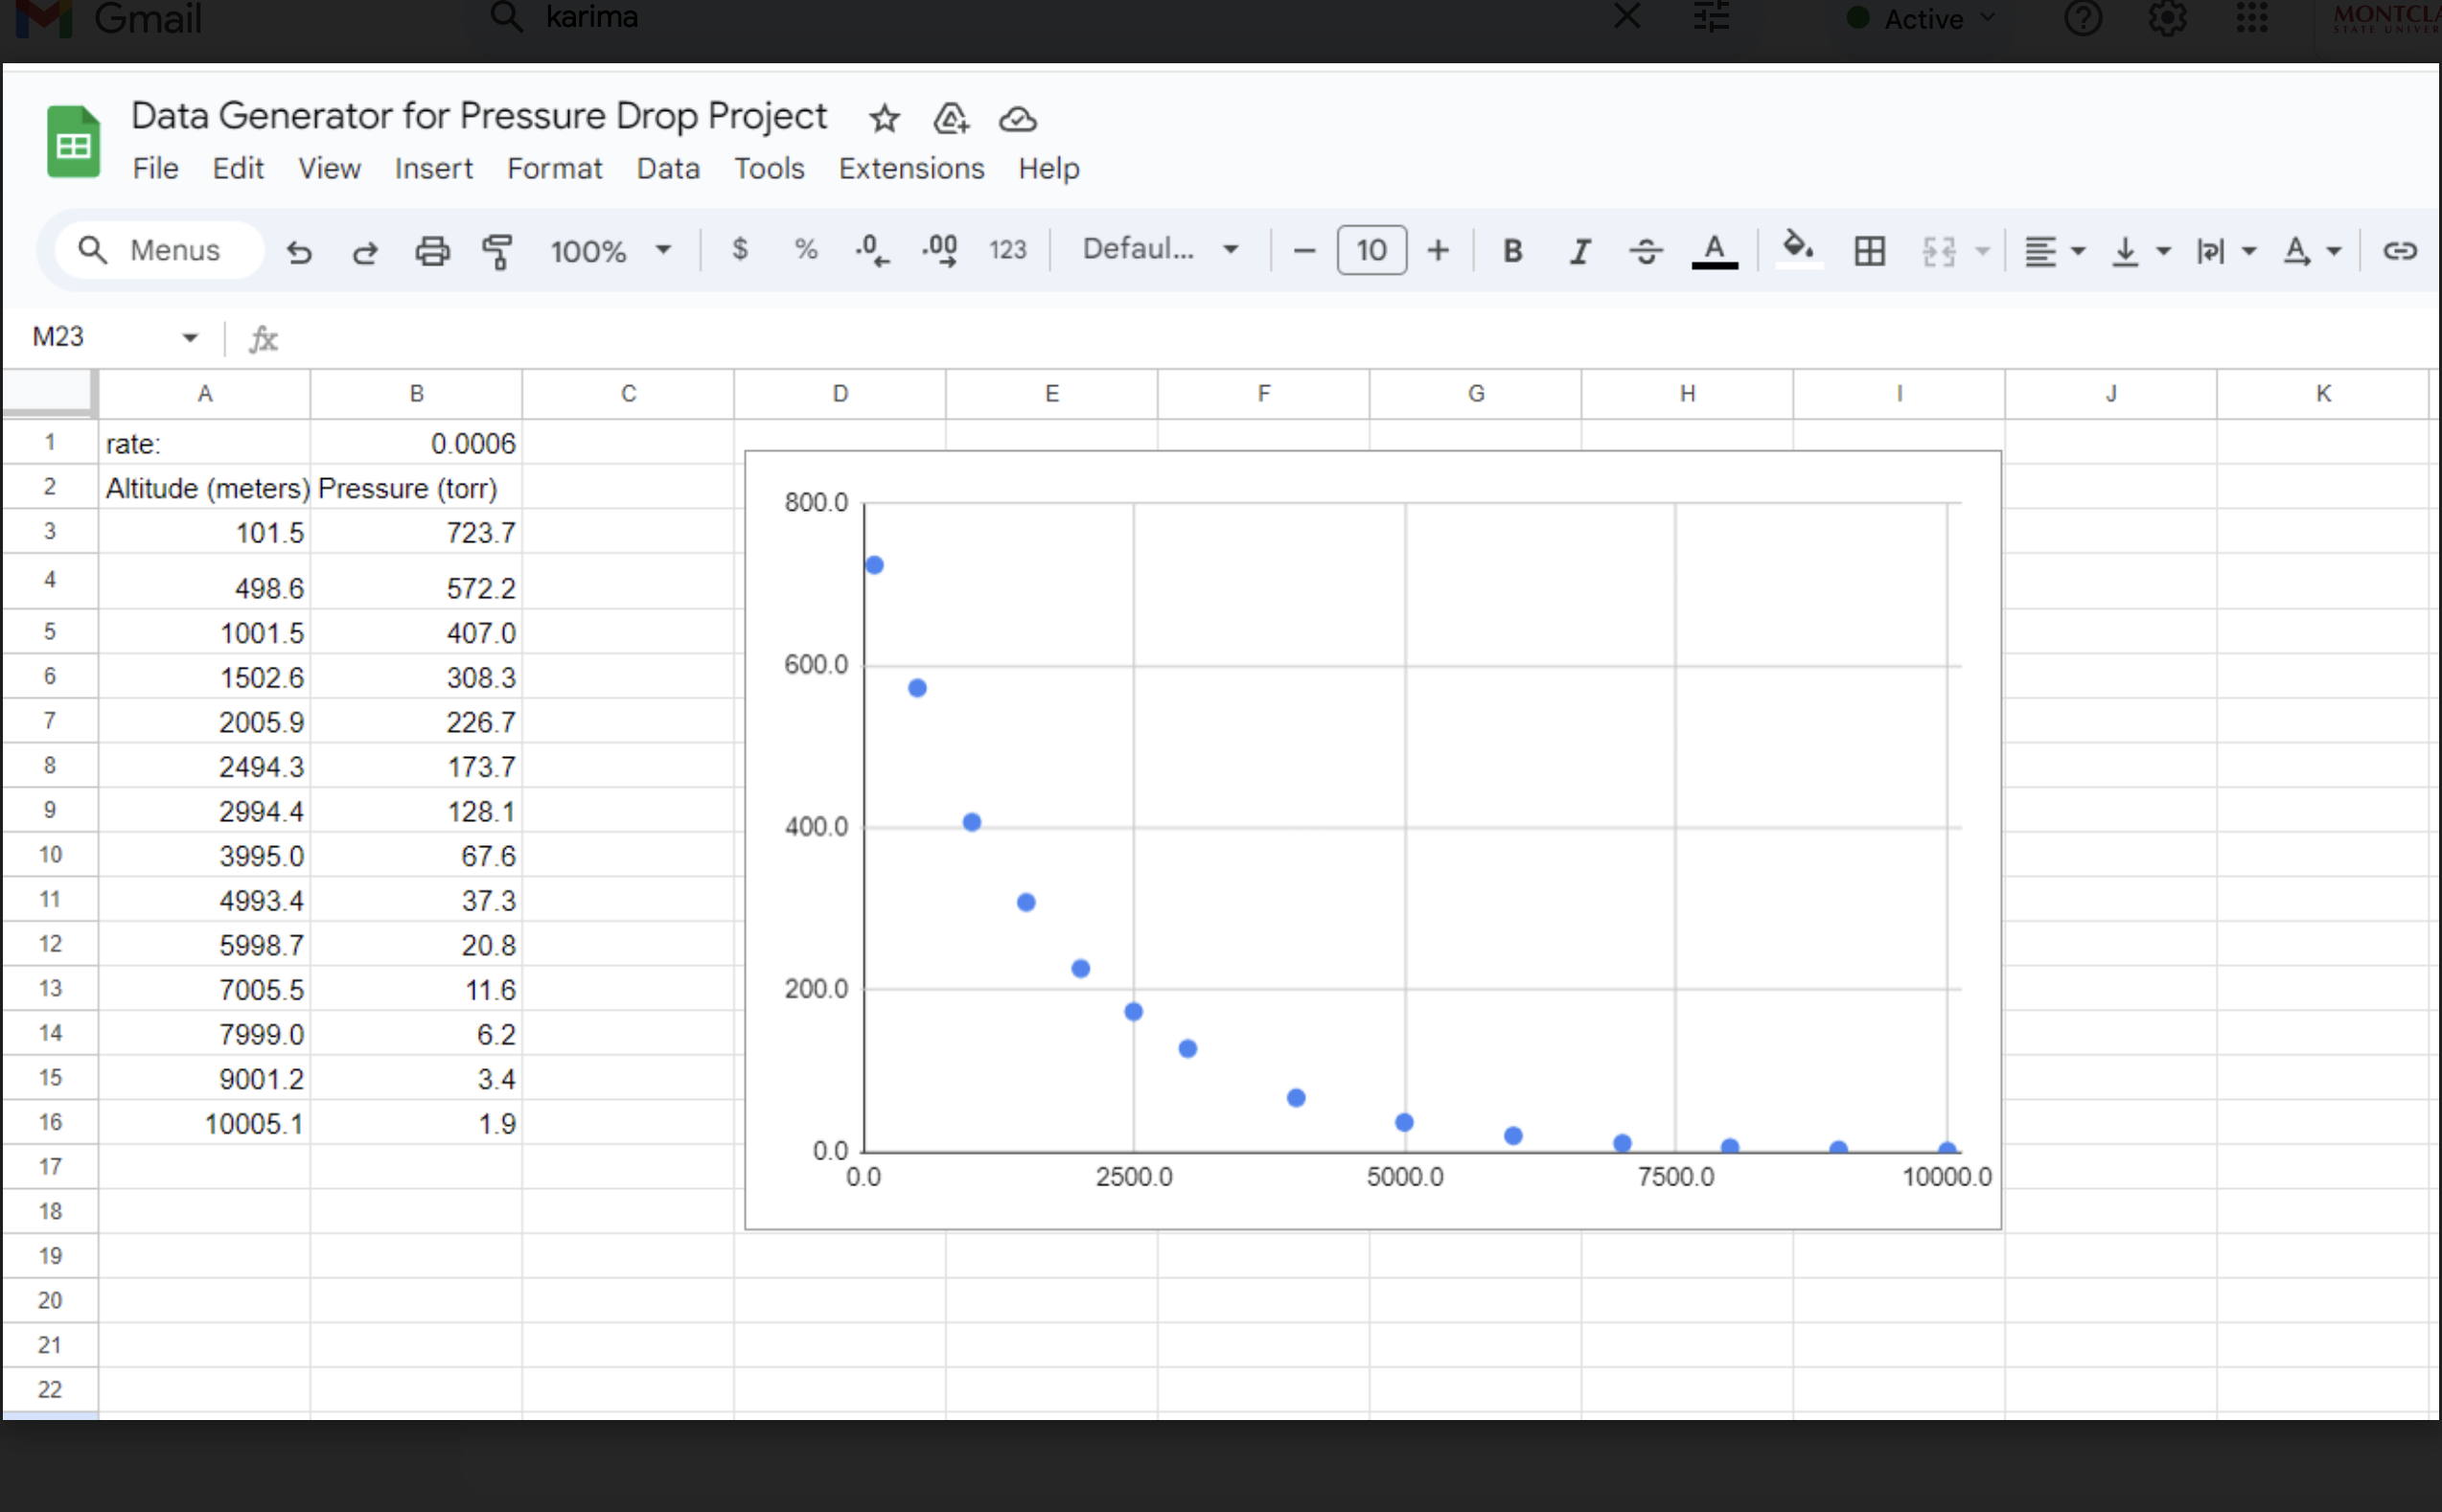
AMAT 120 - Project - Pressure Drop Instructions Complete a report that is responsive to each of the items below. Your report should show enough detail that a reader could reproduce similar results with their own data. For items in which the prompt calls for an explanation and/or comparison, your response should include full sentences. However, an extensive narrative is not required. Any responsive tables and plots should be incorporated into your report document. Your report should be submitted as a physical document in person during class time. Emailed copies will NOT be accepted. Do not include the text from this prompt in your report. Each Project team will receive their own data. Items for Report 1. Use the given data to estimate the rate of change of atmospheric pressure with respect to altitude at different heights over the range covered by the data. Include a table in your response. 2. Construct a function that models the given pressure-altitude data. Create a plot that includes both (a) the model function and (b) the data. Explain briefly how you chose your model function, including the values of any parameters. 3. Use your model function (from Part 2) to compute a formula for the rate of change of atmospheric pressure with respect to altitude. 4. Together on the same plot, show the rate of change of atmospheric pressure with respect to altitude as (i) estimated directly from the data (Part 1) and (ii) computed with the model function (Part 3). 5. Compare the rate of change you estimated directly from the data (Part 4.i) with the rate of change you computed from the model function (Part 4.ii). Use this comparison to assess your model function. E Data Generator for Pressure Drop Project % & & File Edit View Insert Format Data Tools Extensions Help Q Menus e & F 100% ~ % 0. -00 123 Defaul. v | [10 |+ B rate: 0.0006 Altitude (meters) Pressure (torr) 101.5 7237 4986 5722 1001.5 407.0 1502.6 308.3 2005.9 226.7 24943 173.7 2994 4 128.1 3995.0 67.6 4993.4 37.3 5998.7 208 7005.5 116 7999.0 6.2 9001.2 34 10005.1 19 - 10000.0
Step by Step Solution
There are 3 Steps involved in it

Get step-by-step solutions from verified subject matter experts