

Question: Ambient S X Bb Regression > Bb Blackboard X Bb Collabc X Google Di X M MyOpenM X C A Research X C A Research
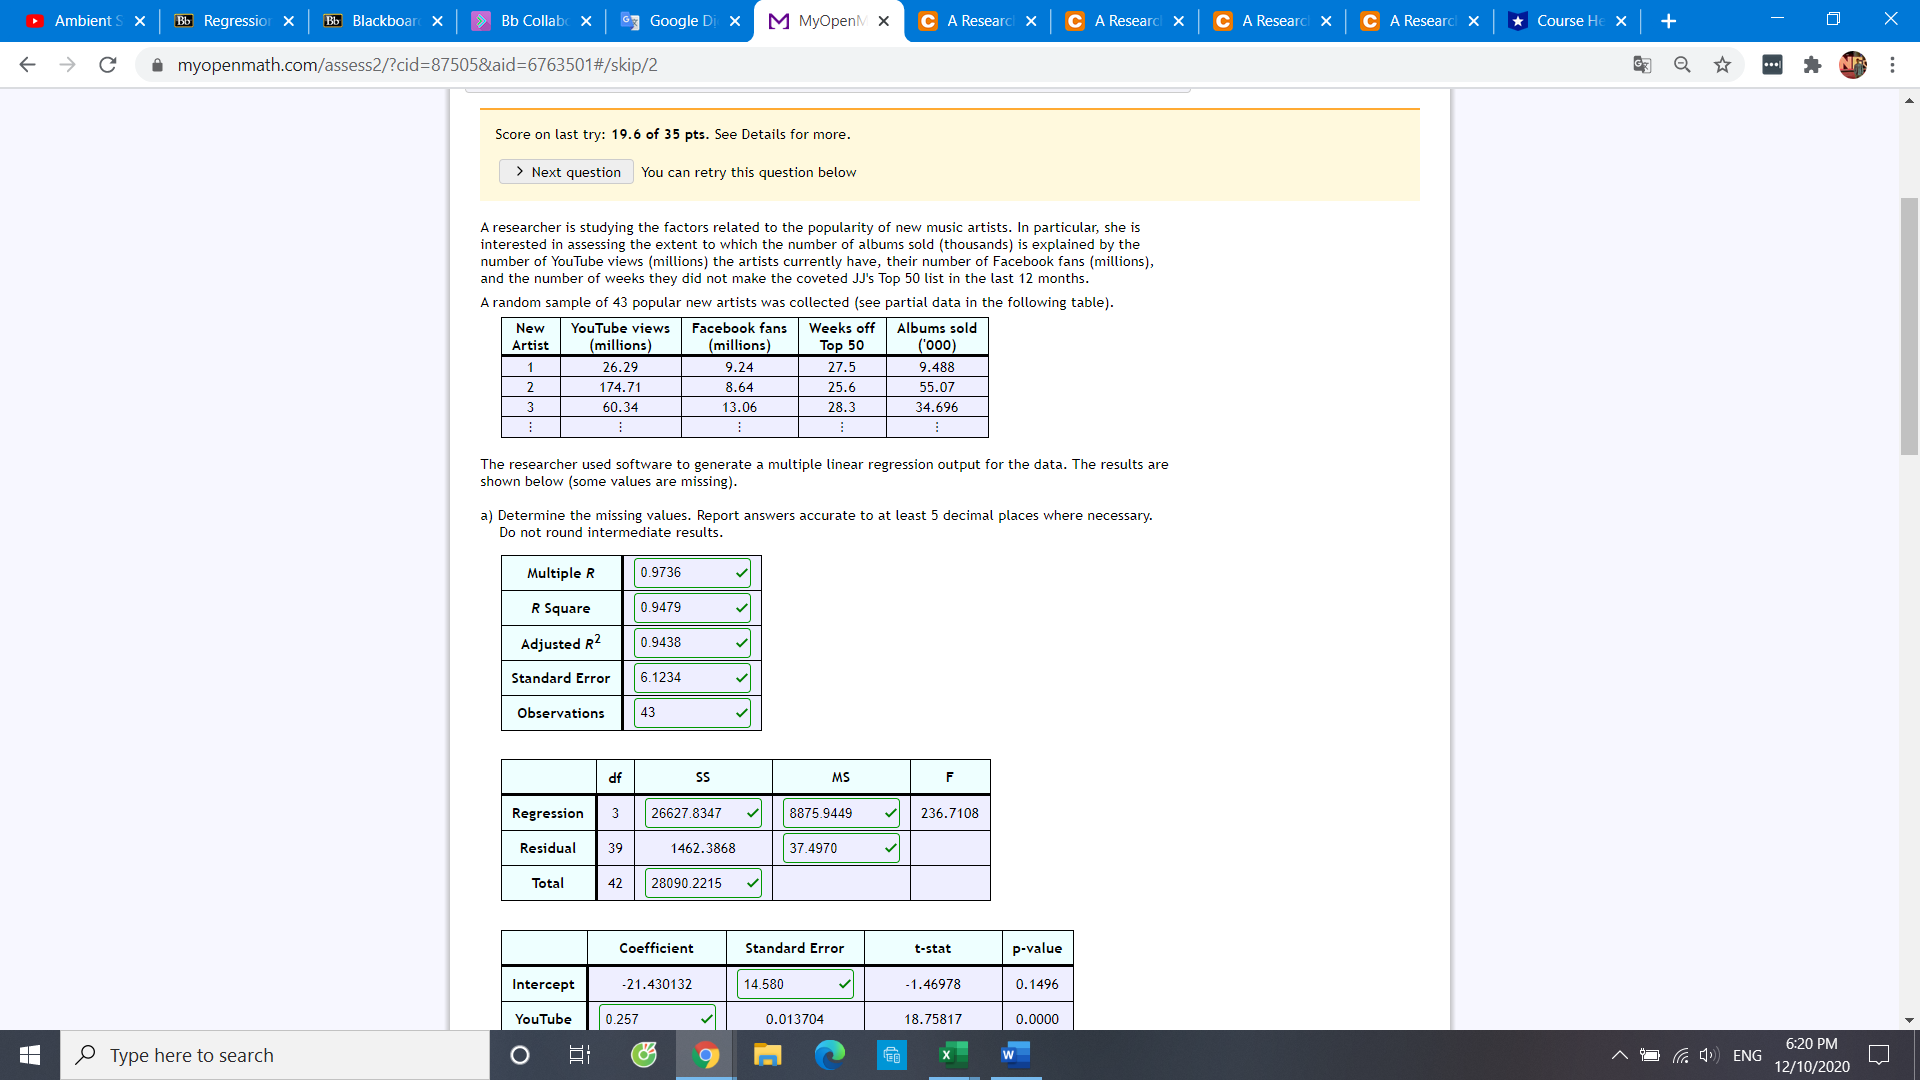
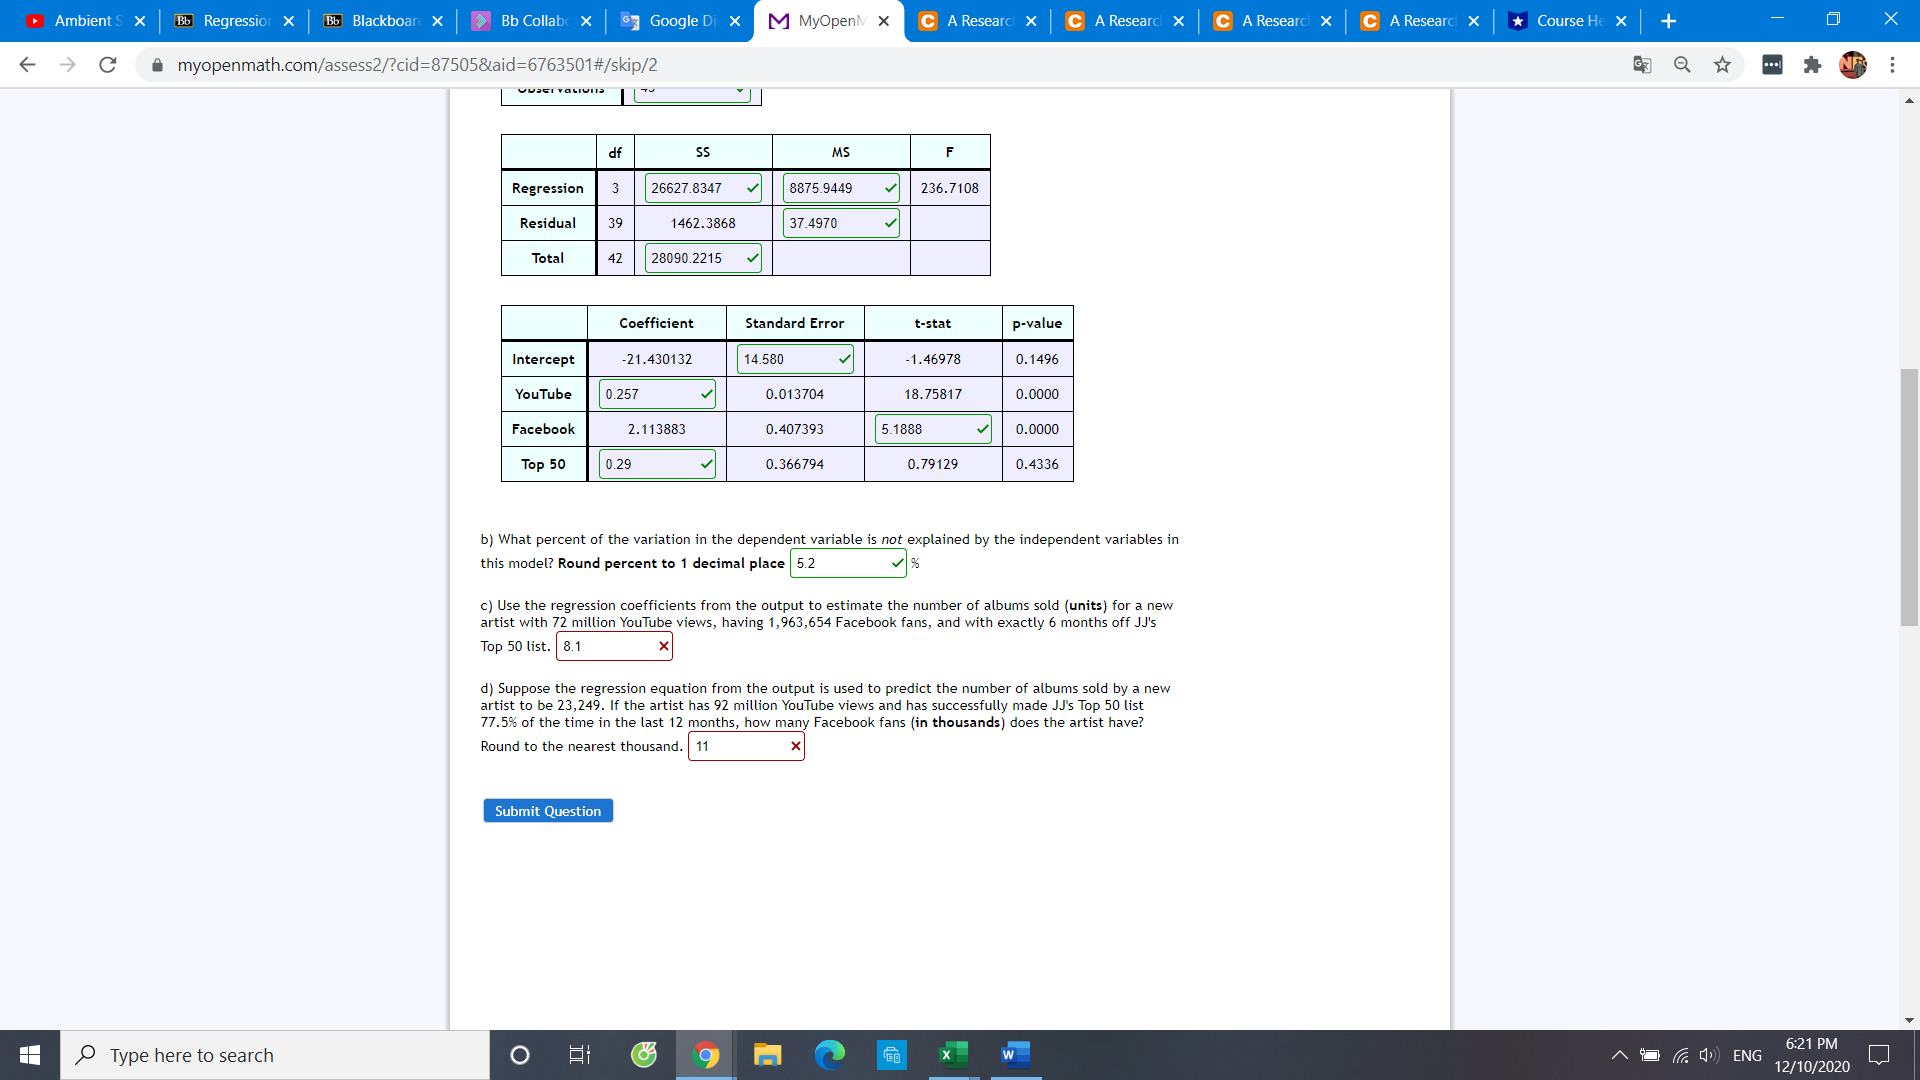
Ambient S X Bb Regression > Bb Blackboard X Bb Collabc X Google Di X M MyOpenM X C A Research X C A Research X C A Research X C A Research X Course He X + X C a myopenmath.com/assess2/?cid=87505&aid=6763501#/skip/2 Q . NF Score on last try: 19.6 of 35 pts. See Details for more. > Next question You can retry this question below A researcher is studying the factors related to the popularity of new music artists. In particular, she is interested in assessing the extent to which the number of albums sold (thousands) is explained by the number of YouTube views (millions) the artists currently have, their number of Facebook fans (millions), and the number of weeks they did not make the coveted JJ's Top 50 list in the last 12 months. A random sample of 43 popular new artists was collected (see partial data in the following table). New YouTube views Facebook fans | Weeks off Albums sold Artist (millions) (millions) Top 50 ('000 26.29 .24 27.5 9.488 174.7 8.64 25.6 55.07 0.34 3.06 28.3 34.696 The researcher used software to generate a multiple linear regression output for the data. The results are shown below (some values are missing). a) Determine the missing values. Report answers accurate to at least 5 decimal places where necessary. Do not round intermediate results. Multiple R 0.9736 R Square 0.9479 Adjusted RZ 0.9438 Standard Error 6.1234 Observations 43 df SS MS F Regression 3 26627.8347 8875.9449 236.7108 Residual 39 1462.3868 37.4970 Total 42 28090.2215 Coefficient Standard Error -stat p-value Intercept 21.430132 14.580 -1.46978 0. 1496 YouTube 0.257 0.013704 8.75817 0.0000 Type here to search O 9 ED ENG 6:20 PM 12/10/2020Ambient S X Bb Regression > Bb Blackboard X Bb Collabc x Google Di X M MyOpenM X C A Research X C A Research X C A Research X C A Research X Course He E X + X C ^ myopenmath.com/assess2/?cid=87505&aid=6763501#/skip/2 Q NF VUSEI VaLUIZ MS Regression 3 26627.8347 8875.9449 236.7108 Residual 1462.3868 37.4970 Total 47 28090.2215 Coefficient Standard Error t-stat p-value Intercept -21.430132 14.580 -1.46978 0. 1496 YouTube 0.257 0.013704 18.75817 0.0000 Facebook 2. 113883 0.407393 5 .1888 0.0000 Top 50 0.29 0.366794 0.79129 0.4336 b) What percent of the variation in the dependent variable is not explained by the independent variables in this model? Round percent to 1 decimal place |5.2 c) Use the regression coefficients from the output to estimate the number of albums sold (units) for a new artist with 72 million YouTube views, having 1, 963,654 Facebook fans, and with exactly 6 months off JJ's Top 50 list. 8.1 d) Suppose the regression equation from the output is used to predict the number of albums sold by a new artist to be 23,249. If the artist has 92 million YouTube views and has successfully made JJ's Top 50 list 77.5% of the time in the last 12 months, how many Facebook fans (in thousands) does the artist have? Round to the nearest thousand. 11 X Submit Question Type here to search O Ei X w 6:21 PM 12/10/2020
Step by Step Solution
There are 3 Steps involved in it

Get step-by-step solutions from verified subject matter experts