

Question: amswer part c (draw the PDM please) Consider the project information shown in the table below. The way this company stores project information, the difference
amswer part c (draw the PDM please) 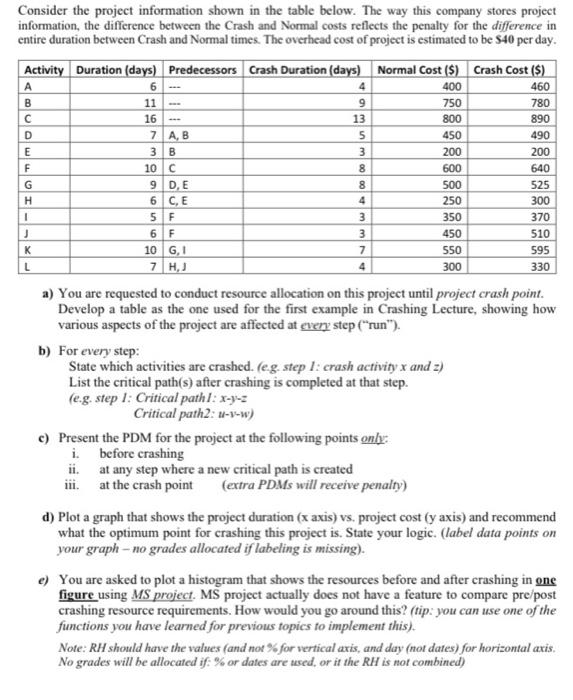
Consider the project information shown in the table below. The way this company stores project information, the difference between the Crash and Normal costs reflects the penalty for the difference in entire duration between Crash and Normal times. The overhead cost of project is estimated to be S40 per day. Activity Duration days) Predecessors Crash Duration (days) Normal Cost ($) Crash Cost ($) A 6 4 400 460 B 11 9 750 780 16 13 800 890 D 7 AB 5 450 490 E 3B 3 200 200 F 10C 8 600 640 G 9 DE 8 500 525 H 6 CE 4 250 300 1 5 F 3 350 370 6F 3 450 510 K 10G, 7 550 595 L 7 H, 4 300 330 a) You are requested to conduct resource allocation on this project until project crash point. Develop a table as the one used for the first example in Crashing Lecture, showing how various aspects of the project are affected at every step ("run"). b) For every step: State which activities are crashed. (eg. step 1: crash activity x and 2) List the critical path(s) after crashing is completed at that step. (e.g. step 1: Critical pathl: x-y-3 Critical path2: 1-1-w) c) Present the PDM for the project at the following points only: i before crashing ii. at any step where a new critical path is created iii. at the crash point (extra PDMs will receive penalty) d) Plot a graph that shows the project duration (x axis) vs, project cost (y axis) and recommend what the optimum point for crashing this project is. State your logic. (label data points on your graph - no grades allocated if labeling is missing). e) You are asked to plot a histogram that shows the resources before and after crashing in one figure using MS project. MS project actually does not have a feature to compare pre/post crashing resource requirements. How would you go around this? (tip: you can use one of the functions you have learned for previous topics to implement this). Note: RH should have the values and not for vertical axis, and day (nor dates) for horizontal axis. No grades will be allocated if: % or dates are used, or it the RH is not combined) Consider the project information shown in the table below. The way this company stores project information, the difference between the Crash and Normal costs reflects the penalty for the difference in entire duration between Crash and Normal times. The overhead cost of project is estimated to be S40 per day. Activity Duration days) Predecessors Crash Duration (days) Normal Cost ($) Crash Cost ($) A 6 4 400 460 B 11 9 750 780 16 13 800 890 D 7 AB 5 450 490 E 3B 3 200 200 F 10C 8 600 640 G 9 DE 8 500 525 H 6 CE 4 250 300 1 5 F 3 350 370 6F 3 450 510 K 10G, 7 550 595 L 7 H, 4 300 330 a) You are requested to conduct resource allocation on this project until project crash point. Develop a table as the one used for the first example in Crashing Lecture, showing how various aspects of the project are affected at every step ("run"). b) For every step: State which activities are crashed. (eg. step 1: crash activity x and 2) List the critical path(s) after crashing is completed at that step. (e.g. step 1: Critical pathl: x-y-3 Critical path2: 1-1-w) c) Present the PDM for the project at the following points only: i before crashing ii. at any step where a new critical path is created iii. at the crash point (extra PDMs will receive penalty) d) Plot a graph that shows the project duration (x axis) vs, project cost (y axis) and recommend what the optimum point for crashing this project is. State your logic. (label data points on your graph - no grades allocated if labeling is missing). e) You are asked to plot a histogram that shows the resources before and after crashing in one figure using MS project. MS project actually does not have a feature to compare pre/post crashing resource requirements. How would you go around this? (tip: you can use one of the functions you have learned for previous topics to implement this). Note: RH should have the values and not for vertical axis, and day (nor dates) for horizontal axis. No grades will be allocated if: % or dates are used, or it the RH is not combined) Step by Step Solution
There are 3 Steps involved in it
1 Expert Approved Answer
Step: 1 Unlock

Question Has Been Solved by an Expert!
Get step-by-step solutions from verified subject matter experts
Step: 2 Unlock
Step: 3 Unlock