

Question: An analyst created two sets from the Customer field: - Set 1 - Bottom 100 by Average Profit - Set 2 - Condition by field
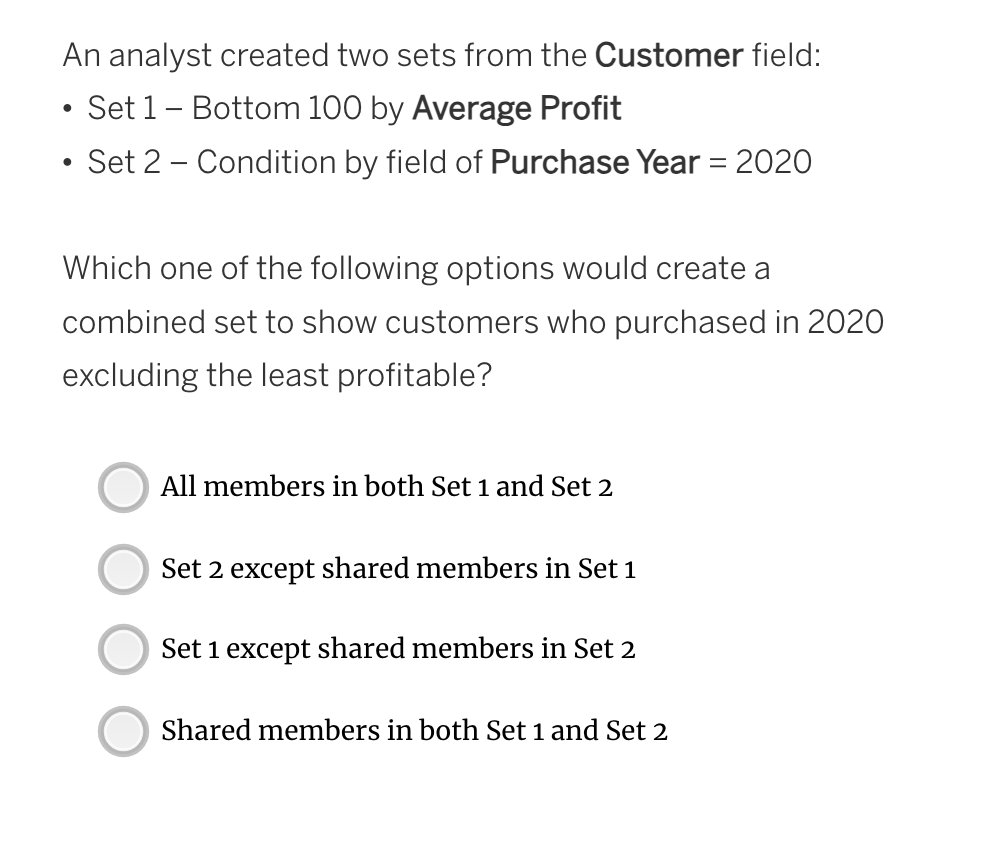
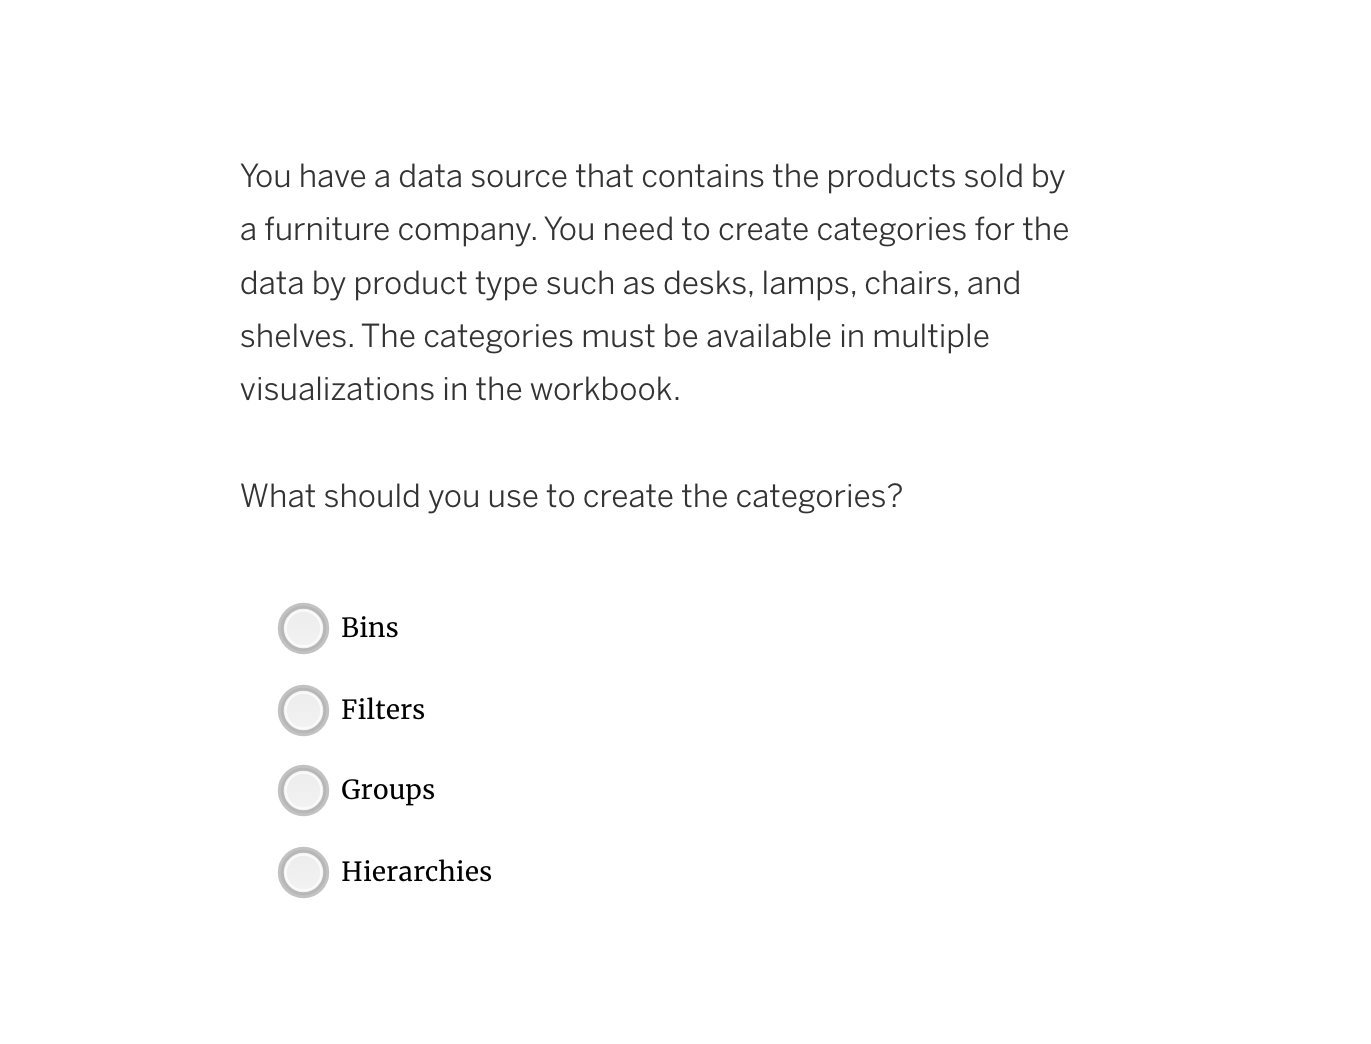
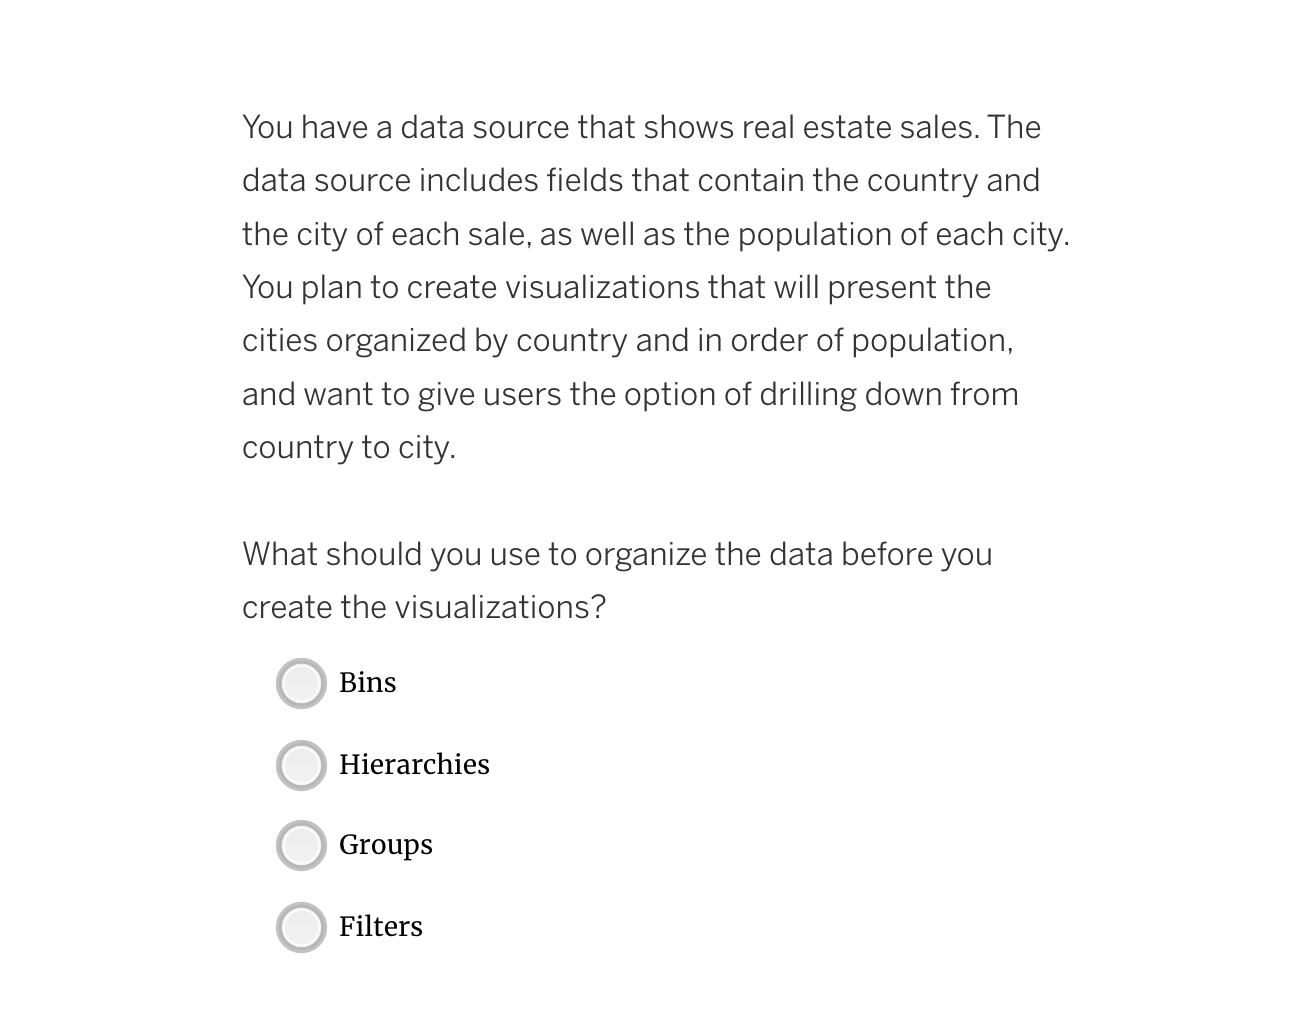
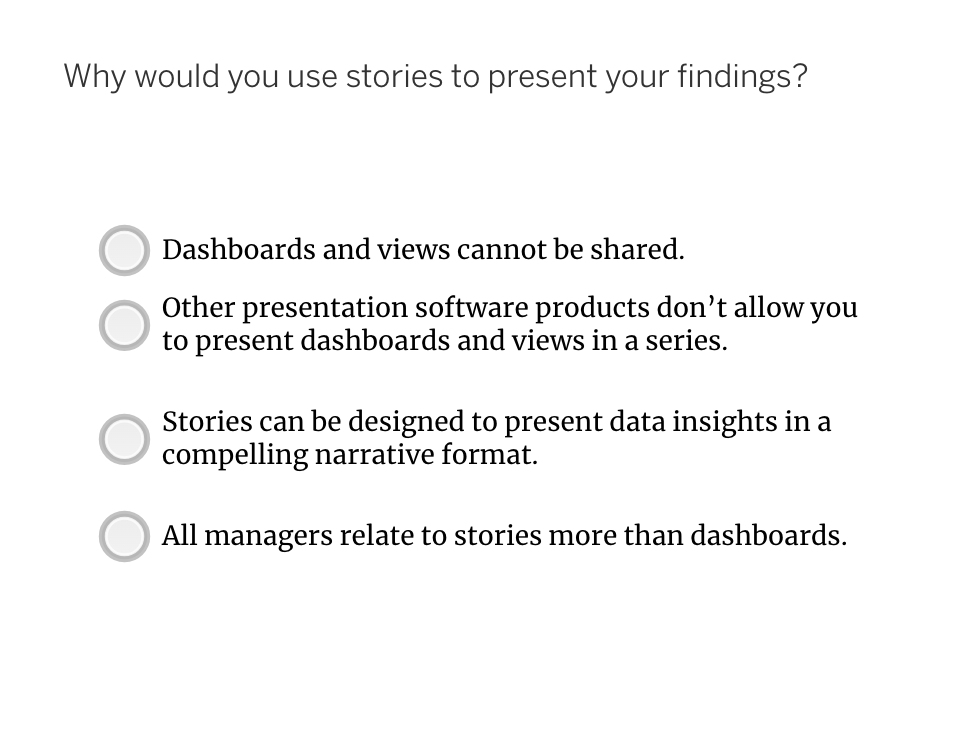
An analyst created two sets from the Customer field: - Set 1 - Bottom 100 by Average Profit - Set 2 - Condition by field of Purchase Year =2020 Which one of the following options would create a combined set to show customers who purchased in 2020 excluding the least profitable? All members in both Set 1 and Set 2 Set 2 except shared members in Set 1 Set 1 except shared members in Set 2 Shared members in both Set 1 and Set 2 You have a data source that contains the products sold by a furniture company. You need to create categories for the data by product type such as desks, lamps, chairs, and shelves. The categories must be available in multiple visualizations in the workbook. What should you use to create the categories? Bins Filters Groups Hierarchies You have a data source that shows real estate sales. The data source includes fields that contain the country and the city of each sale, as well as the population of each city. You plan to create visualizations that will present the cities organized by country and in order of population, and want to give users the option of drilling down from country to city. What should you use to organize the data before you create the visualizations? Bins Hierarchies Groups Filters Why would you use stories to present your findings? Dashboards and views cannot be shared. Other presentation software products don't allow you to present dashboards and views in a series. Stories can be designed to present data insights in a compelling narrative format. All managers relate to stories more than dashboards. You built a dashboard with several views exploring your product inventory data set. One of the views should display only products that have a quantity below 50 . Which type of filter should you use in this case? A table calculation filter An extract filter A measure filter A data source filter
Step by Step Solution
There are 3 Steps involved in it

Get step-by-step solutions from verified subject matter experts