

An analyst for a firm has been asked to determine what factors can be used to...
Fantastic news! We've Found the answer you've been seeking!
Question:
Transcribed Image Text:
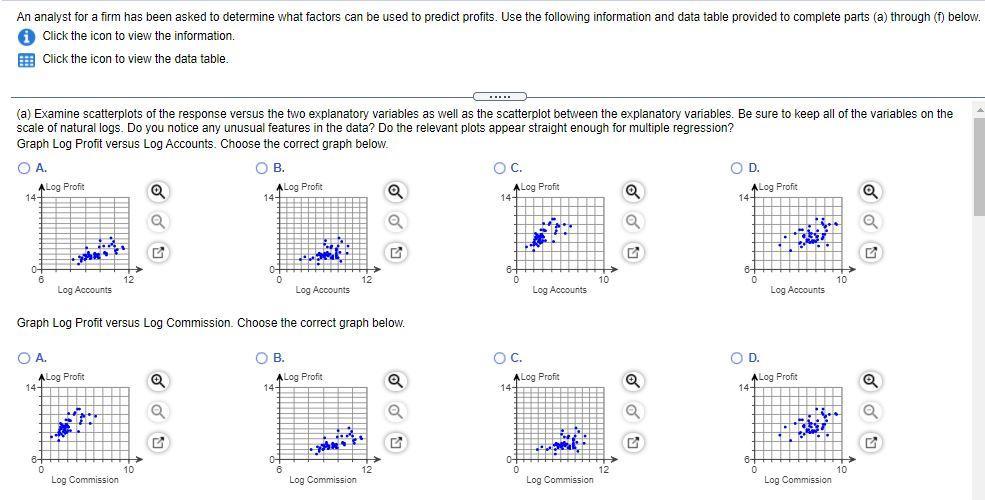
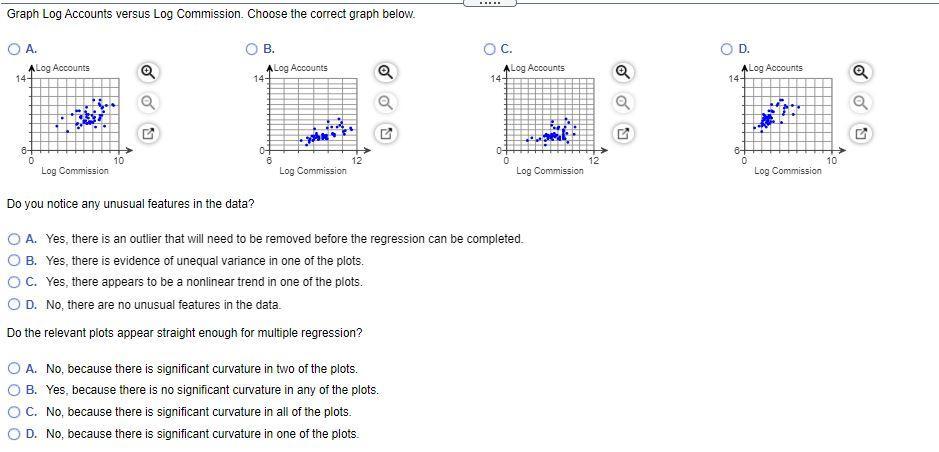
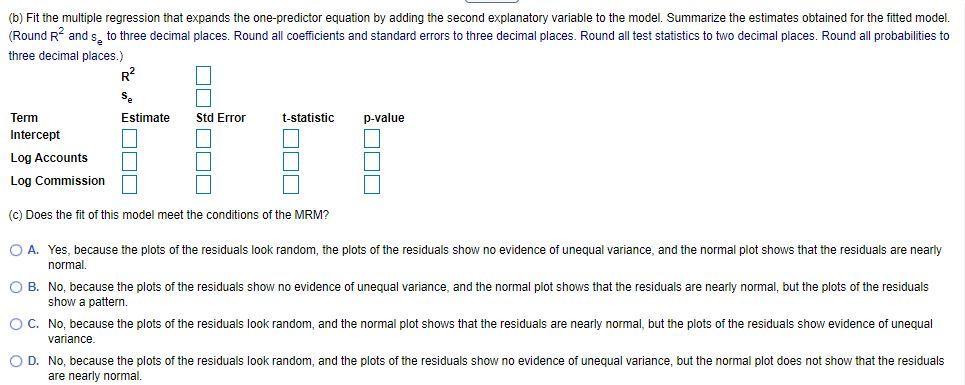
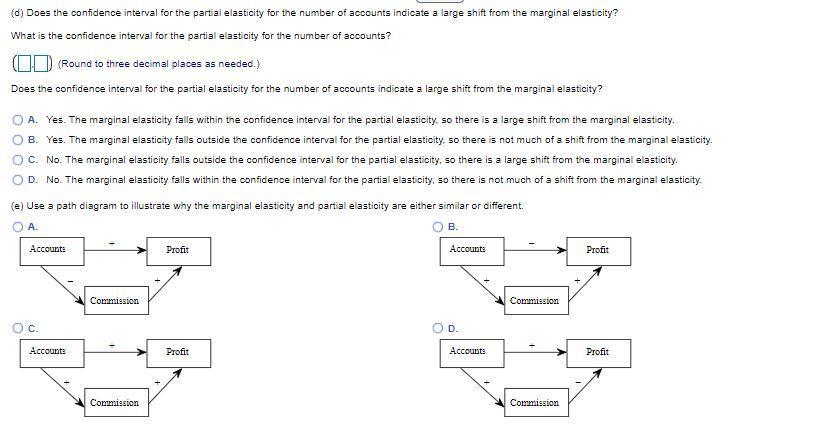
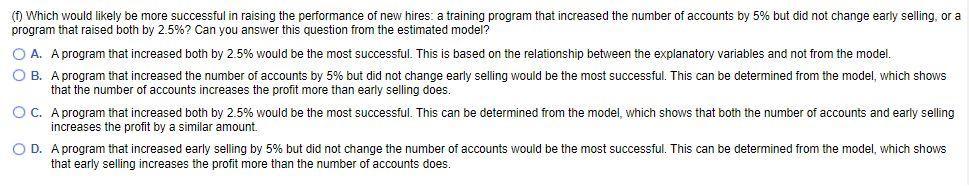
An analyst for a firm has been asked to determine what factors can be used to predict profits. Use the following information and data table provided to complete parts (a) through (f) below. i Click the icon to view the information. Click the icon to view the data table. (...) (a) Examine scatterplots of the response versus the two explanatory variables as well as the scatterplot between the explanatory variables. Be sure to keep all of the variables on the scale of natural logs. Do you notice any unusual features in the data? Do the relevant plots appear straight enough for multiple regression? Graph Log Profit versus Log Accounts. Choose the correct graph below. O A. O B. ALog Profit 14- O A. **** 14- Log Accounts ALog Profit 0 MAT Log Commission Q 10 Q Graph Log Profit versus Log Commission. Choose the correct graph below. 5 14 Q Q ALog Profit Log Accounts B. ALog Profit 14- 6 •*•** Log Commission Q Q 12 G Q Q O C. ALog Profit 14+ O C. 14- Log Accounts Log Profit Log Commission 10 12 Q Q 5 Q Q O D. ALog Profit 14- D. 14- Log Accounts Log Profit Log Commission 10 10 Q Q 2 Q Q Graph Log Accounts versus Log Commission. Choose the correct graph below. OA. ALog Accounts 14- 10 B. ALog Accounts 14- Ak Log Commission ***** Log Commission Do you notice any unusual features in the data? O A. Yes, there is an outlier that will need to be removed before the regression can be completed. B. Yes, there is evidence of unequal variance in one of the plots. C. Yes, there appears to be a nonlinear trend in one of the plots. O D. No, there are no unusual features in the data. Do the relevant plots appear straight enough for multiple regression? O A. No, because there is significant curvature in two of the plots. B. Yes, because there is no significant curvature in any of the plots. C. No, because there is significant curvature in all of the plots. D. No, because there is significant curvature in one of the plots. O. C. ALog Accounts 14- Log Commission Q D. ALog Accounts 14- Log Commission 10 (b) Fit the multiple regression that expands the one-predictor equation by adding the second explanatory variable to the model. Summarize the estimates obtained for the fitted model. (Round R² and so to three decimal places. Round all coefficients and standard errors to three decimal places. Round all test statistics to two decimal places. Round all probabilities to three decimal places.) Estimate Std Error etter (c) Does the fit of this model meet the conditions of the MRM? Term Intercept Log Accounts Log Commission t-statistic p-value OA. Yes, because the plots of the residuals look random, the plots of the residuals show no evidence of unequal variance, and the normal plot shows that the residuals are nearly normal. O B. No, because the plots of the residuals show no evidence of unequal variance, and the normal plot shows that the residuals are nearly normal, but the plots of the residuals show a pattern. O C. No, because the plots of the residuals look random, and the normal plot shows that the residuals are nearly normal, but the plots of the residuals show evidence of unequal variance. O D. No, because the plots of the residuals look random, and the plots of the residuals show no evidence of unequal variance, but the normal plot does not show that the residuals are nearly normal. (d) Does the confidence interval for the partial elasticity for the number of accounts indicate a large shift from the marginal elasticity? What is the confidence interval for the partial elasticity for the number of accounts? (Round to three decimal places as needed.) Does the confidence interval for the partial elasticity for the number of accounts indicate a large shift from the marginal elasticity? A. Yes. The marginal elasticity falls within the confidence interval for the partial elasticity, so there is a large shift from the marginal elasticity. B. Yes. The marginal elasticity falls outside the confidence interval for the partial elasticity, so there is not much of a shift from the marginal elasticity. C. No. The marginal elasticity falls outside the confidence interval for the partial elasticity, so there is a large shift from the marginal elasticity. D. No. The marginal elasticity falls within the confidence interval for the partial elasticity, so there is not much of a shift from the marginal elasticity. (e) Use a path diagram to illustrate why the marginal elasticity and partial elasticity are either similar or different. A. B. Accounts O c. Accounts Commission Commission Profit Profit Accounts D. Accounts Commission Commission Profit Profit (1) Which would likely be more successful in raising the performance of new hires: a training program that increased the number of accounts by 5% but did not change early selling, or a program that raised both by 2.5%? Can you answer this question from the estimated model? O A. A program that increased both by 2.5% would be the most successful. This is based on the relationship between the explanatory variables and not from the model. OB. A program that increased the number of accounts by 5% but did not change early selling would be the most successful. This can be determined from the model, which shows that the number of accounts increases the profit more than early selling does. OC. A program that increased both by 2.5% would be the most successful. This can be determined from the model, which shows that both the number of accounts and early selling increases the profit by a similar amount. OD. A program that increased early selling by 5% but did not change the number of accounts would be the most successful. This can be determined from the model, which shows that early selling increases the profit more than the number of accounts does. An analyst for a firm has been asked to determine what factors can be used to predict profits. Use the following information and data table provided to complete parts (a) through (f) below. i Click the icon to view the information. Click the icon to view the data table. (...) (a) Examine scatterplots of the response versus the two explanatory variables as well as the scatterplot between the explanatory variables. Be sure to keep all of the variables on the scale of natural logs. Do you notice any unusual features in the data? Do the relevant plots appear straight enough for multiple regression? Graph Log Profit versus Log Accounts. Choose the correct graph below. O A. O B. ALog Profit 14- O A. **** 14- Log Accounts ALog Profit 0 MAT Log Commission Q 10 Q Graph Log Profit versus Log Commission. Choose the correct graph below. 5 14 Q Q ALog Profit Log Accounts B. ALog Profit 14- 6 •*•** Log Commission Q Q 12 G Q Q O C. ALog Profit 14+ O C. 14- Log Accounts Log Profit Log Commission 10 12 Q Q 5 Q Q O D. ALog Profit 14- D. 14- Log Accounts Log Profit Log Commission 10 10 Q Q 2 Q Q Graph Log Accounts versus Log Commission. Choose the correct graph below. OA. ALog Accounts 14- 10 B. ALog Accounts 14- Ak Log Commission ***** Log Commission Do you notice any unusual features in the data? O A. Yes, there is an outlier that will need to be removed before the regression can be completed. B. Yes, there is evidence of unequal variance in one of the plots. C. Yes, there appears to be a nonlinear trend in one of the plots. O D. No, there are no unusual features in the data. Do the relevant plots appear straight enough for multiple regression? O A. No, because there is significant curvature in two of the plots. B. Yes, because there is no significant curvature in any of the plots. C. No, because there is significant curvature in all of the plots. D. No, because there is significant curvature in one of the plots. O. C. ALog Accounts 14- Log Commission Q D. ALog Accounts 14- Log Commission 10 (b) Fit the multiple regression that expands the one-predictor equation by adding the second explanatory variable to the model. Summarize the estimates obtained for the fitted model. (Round R² and so to three decimal places. Round all coefficients and standard errors to three decimal places. Round all test statistics to two decimal places. Round all probabilities to three decimal places.) Estimate Std Error etter (c) Does the fit of this model meet the conditions of the MRM? Term Intercept Log Accounts Log Commission t-statistic p-value OA. Yes, because the plots of the residuals look random, the plots of the residuals show no evidence of unequal variance, and the normal plot shows that the residuals are nearly normal. O B. No, because the plots of the residuals show no evidence of unequal variance, and the normal plot shows that the residuals are nearly normal, but the plots of the residuals show a pattern. O C. No, because the plots of the residuals look random, and the normal plot shows that the residuals are nearly normal, but the plots of the residuals show evidence of unequal variance. O D. No, because the plots of the residuals look random, and the plots of the residuals show no evidence of unequal variance, but the normal plot does not show that the residuals are nearly normal. (d) Does the confidence interval for the partial elasticity for the number of accounts indicate a large shift from the marginal elasticity? What is the confidence interval for the partial elasticity for the number of accounts? (Round to three decimal places as needed.) Does the confidence interval for the partial elasticity for the number of accounts indicate a large shift from the marginal elasticity? A. Yes. The marginal elasticity falls within the confidence interval for the partial elasticity, so there is a large shift from the marginal elasticity. B. Yes. The marginal elasticity falls outside the confidence interval for the partial elasticity, so there is not much of a shift from the marginal elasticity. C. No. The marginal elasticity falls outside the confidence interval for the partial elasticity, so there is a large shift from the marginal elasticity. D. No. The marginal elasticity falls within the confidence interval for the partial elasticity, so there is not much of a shift from the marginal elasticity. (e) Use a path diagram to illustrate why the marginal elasticity and partial elasticity are either similar or different. A. B. Accounts O c. Accounts Commission Commission Profit Profit Accounts D. Accounts Commission Commission Profit Profit (1) Which would likely be more successful in raising the performance of new hires: a training program that increased the number of accounts by 5% but did not change early selling, or a program that raised both by 2.5%? Can you answer this question from the estimated model? O A. A program that increased both by 2.5% would be the most successful. This is based on the relationship between the explanatory variables and not from the model. OB. A program that increased the number of accounts by 5% but did not change early selling would be the most successful. This can be determined from the model, which shows that the number of accounts increases the profit more than early selling does. OC. A program that increased both by 2.5% would be the most successful. This can be determined from the model, which shows that both the number of accounts and early selling increases the profit by a similar amount. OD. A program that increased early selling by 5% but did not change the number of accounts would be the most successful. This can be determined from the model, which shows that early selling increases the profit more than the number of accounts does.
Expert Answer:
Answer rating: 100% (QA)
Answer i Graph Log Profit versus Log Accounts Correct answer D ii Graph Log Profit versus ... View the full answer

Related Book For 

Business Statistics for Contemporary Decision Making
ISBN: 978-0470910184
6th Edition
Authors: Ken Black
Posted Date:
Students also viewed these accounting questions
-
A research firm has been asked to determine the proportion of all restaurants in the state of Ohio that serve alcoholic beverages. The firm wants to be 98% confident of its results but has no idea of...
-
A research firm has been asked to determine the proportion of all restaurants in the state of Ohio that serve alcoholic beverages. The firm wants to be 98% confident of its results but has no idea of...
-
What factors can be used to measure efficiency?
-
The data below are the calories and grams of sugar in some popular store bought cookies. Calories 143 Grams of Sugar 12 97 9 200 11 149 19 84 4 57 9 198 21
-
The Adjusted Trial Balance section of the worksheet for Vandermeer Farm Supply follows. The owner made no additional investments during the year. Prepare a postclosing trial balance for the firm on...
-
Describe seven basic ways organizations are structured.
-
The prescribed control procedures over manufacturing transactions in the Adrian Company are as follows: 1. Bills of materials for each production order. 2. Authorized production order for each job or...
-
1. List and briefly describe the six different types of fraud symptoms. 2. Describe the different fraud symptoms present at MHZ, Inc. 3. Assume that Hal has access to the companys income statement...
-
Compare and contrast containerization technologies (e.g., Docker, Kubernetes) with traditional virtualization approaches. What are the key differences in terms of resource isolation, performance, and...
-
1)Compute the standard dollar costs for the units of output. 2)Compute AHC factory overhead volume variance. 3)Compute a detailed analysis of AHC Labor using both rate and volume variance. 4)Compute...
-
If the monthly supply of math action figures t months after initial delivery to market is given by the logistical growth function 3000 5 + 15e-1.01t find the carrying capacity of the market. Carrying...
-
Use the piecewise-defined function to find the following values for f(x). 3-4x if x 3 f(x) = 4x if 3
-
Suppose a friend invites you to attend the Opening Day game of your favorite baseball team. You will have to miss a day of work in order to go. You would have earned $40 that day. Your ticket to the...
-
Solve the equation 4 - 512x+1=26 The solutions are: x= Question Help: Video Message instructor Calculator Submit Question
-
The expression 6561gy 6561gy equals ka"y where r, the exponent of g, is: and s, the exponent of y, is: and k, the leading coefficient is:
-
Determine the exact value(s) for which the rational expression f(x) = than one value, list them separated by a comma, e.g. x = 2,3. -11x+1 -30x225x+5 is undefined. If there's more
-
vKaitlin, Hans, and Frank served a total of 67 orders Monday at the school cafeteria. Frank served 3 times as many orders as Hans. Hans served 8 more orders than Kaitlin. How many orders did they...
-
In the busy port of Chennai, India, the number of containers loaded onto ships during a 15-week period is as follows: 1. Develop a linear trend equation to forecast container loadings. 2. Using the...
-
Frito Company was founded in 1932 in San Antonio, Texas, by Elmer Doolin. H.W. Lay & Company was founded in Atlanta, Georgia, by Herman W. Lay in 1938. In 1961, the two companies merged to form...
-
The Nielsen Company compiled a list of the top 25 advertisers in African American media. Shown below are a Minitab descriptive statistics analysis of the annual advertising spending in $ million by...
-
Previous experience shows the variance of a given process to be 14. Researchers are testing to determine whether this value has changed. They gather the following dozen measurements of the process....
-
Consider a scenario where an online trade application is being developed. The two registered users can negotiate over the price of a product being traded. Create a class diagram for this application...
-
Consider a scenario where you negotiate with a company over the salary and perks being offered for a position. Create a class diagram for this using negotiation patterns as your base and draw a...
-
What are the three foundation concepts of stability model?

Study smarter with the SolutionInn App