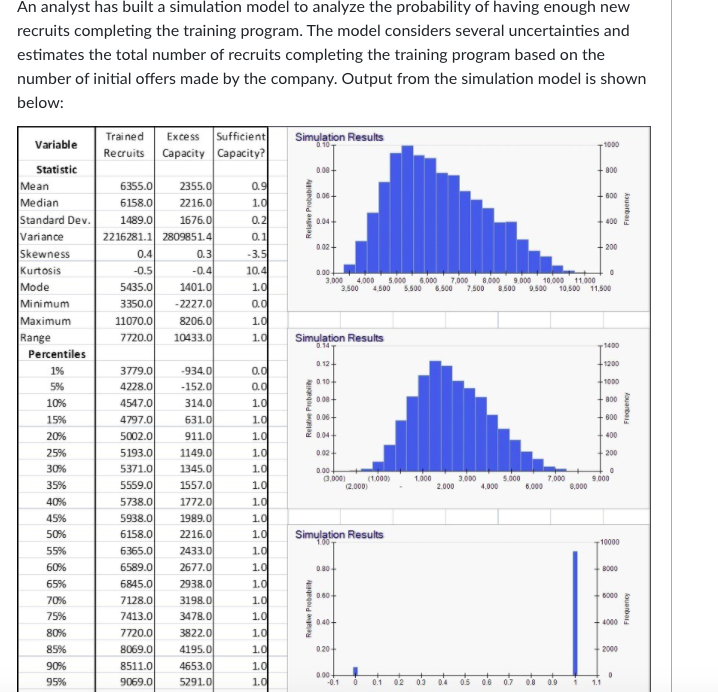
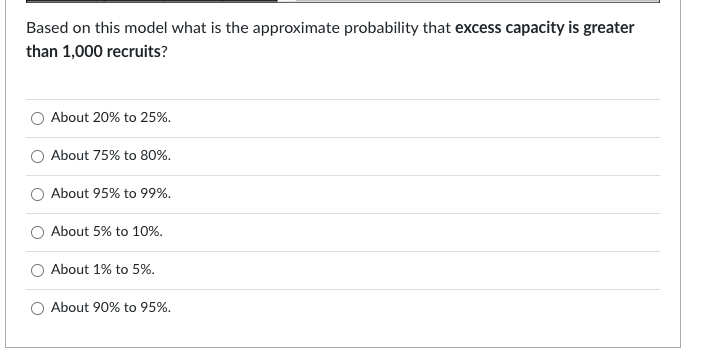
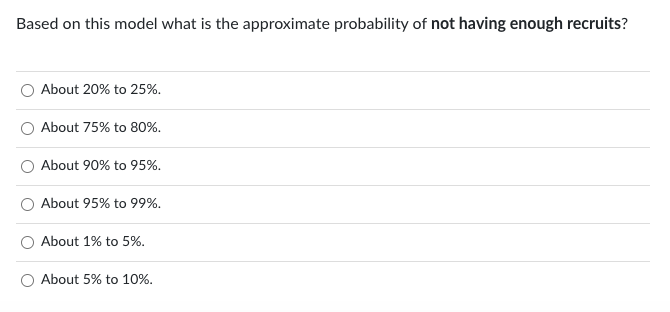
Question: An analyst has built a simulation model to analyze the probability of having enough new recruits completing the training program. The model considers several uncertainties

An analyst has built a simulation model toAn analyst has built a simulation model toAn analyst has built a simulation model toAn analyst has built a simulation model toAn analyst has built a simulation model toAn analyst has built a simulation model to

An analyst has built a simulation model to analyze the probability of having enough new recruits completing the training program. The model considers several uncertainties and estimates the total number of recruits completing the training program based on the number of initial offers made by the company. Output from the simulation model is shown below: Variable Simulation Results Trained Excess Sufficient Recruits Capacity Capacity? 0.101 1000 Statistic 0.00 800 000+ 600 Relative Probability Frequency 0.04 400 0 02 + 200 Mean Median Standard Dev. Variance Skewness Kurtosis Mode Minimum Maximum Range Percentiles 6355.0 2355.0 6158.0 2216.0 1489.0 1676.0 2216281.1 2809851.4 0.4 0.3 -0.5 -0.4 5435.0 1401.01 3350.0 -2227.01 11070.01 8206.0 7720.0 10433.0 0.9 1.0 0.21 0.1 -3.51 10.41 1.0 0.0 1.01 1.0 0.00 3.000 4,000 5 000 000 7,000 8.000 9.000 10.000 11.000 3.500 4.500 5500 8.500 7.500 8.500 9.500 10.500 11.500 Simulation Results 1400 012+ +1200 19 0.0 od 5% +1000 010 800 10% 3779.00 4228.0 4547.0 4797.0 5002.0 008 1.0 1.0 1.0 Relative Probabil Frequency 15% 0.00 20% 0.04 400 25% 0.02 200 1.0 1.0 30% 5193.0 5371.00 5559.00 5738.00 0.00 0.0001 (1000) (2.000) 1.000 3.000 5 000 7 000 0 9.000 35% 2.000 4,000 6.000 8,000 40% 45% 5938.0 -934.0 - 152.0 314.01 631.0 911.00 1149.0 1345.0 1557.00 1772.01 1989.01 2216.0 2433.0 2677.00 2938.0 3198.0 3478.0 3822.00 4195.0 4653.0 5291.0 50% 6158.0 6365.00 Simulation Results 10000 55% 60% 6589.0 0.80 3000 65% 1.0 1.0 1.0 1.0 1.0 1.0 1.0 1.01 1.0 1.0 1.0 1.0 1.0 060 6000 6845.0 7128.0 7413.0 70% Relative Probably Roubai 75% 0.40+ 4000 80% 7720.0 85% 8069.0 020 2000 90% 8511.0 9069.00 000 -0.1 0 95% 0.1 02 03 04 0.5 0.7 0.8 0.9 1 1.1 90% 000 95% 8511.0 9069.0 9921.00 4653.0 5291.0 6380.00 1.0 1.0 1.0 0.1 02 03 0.5 0.6 07 0.8 0.9 1 1.1 99% Based on this model what is the typical or most likely number of recruits completing the training program? 3350 9921 5435 6355 6158 O 11070 If the analyst wants to quote a 90% confidence interval for the total number of trained recruits, what numbers should he use as the upper bound of the confidence interval? 9069 11070 4547 5938 4228 8511 If the analyst wants to quote a 90% confidence interval for the total number of trained recruits, what numbers should he use as the lower bound of the confidence interval? 3350 4228 5938 8511 4547 O 9069 Based on this model what is the approximate probability that excess capacity is greater than 1,000 recruits? About 20% to 25%. About 75% to 80%. About 95% to 99%. About 5% to 10%. About 1% to 5%. About 90% to 95%. Based on this model what is the approximate probability of not having enough recruits? About 20% to 25%. About 75% to 80%. About 90% to 95%. About 95% to 99%. About 1% to 5%. About 5% to 10%

Step by Step Solution

There are 3 Steps involved in it

1 Expert Approved Answer
Step: 1 Unlock blur-text-image
Question Has Been Solved by an Expert!

Get step-by-step solutions from verified subject matter experts

Step: 2 Unlock
Step: 3 Unlock

Students Have Also Explored These Related General Management Questions!