

Question: An analyst has drawn twelve samples, each containing six sample points, from a process that produces a product. The diameter of each product in the
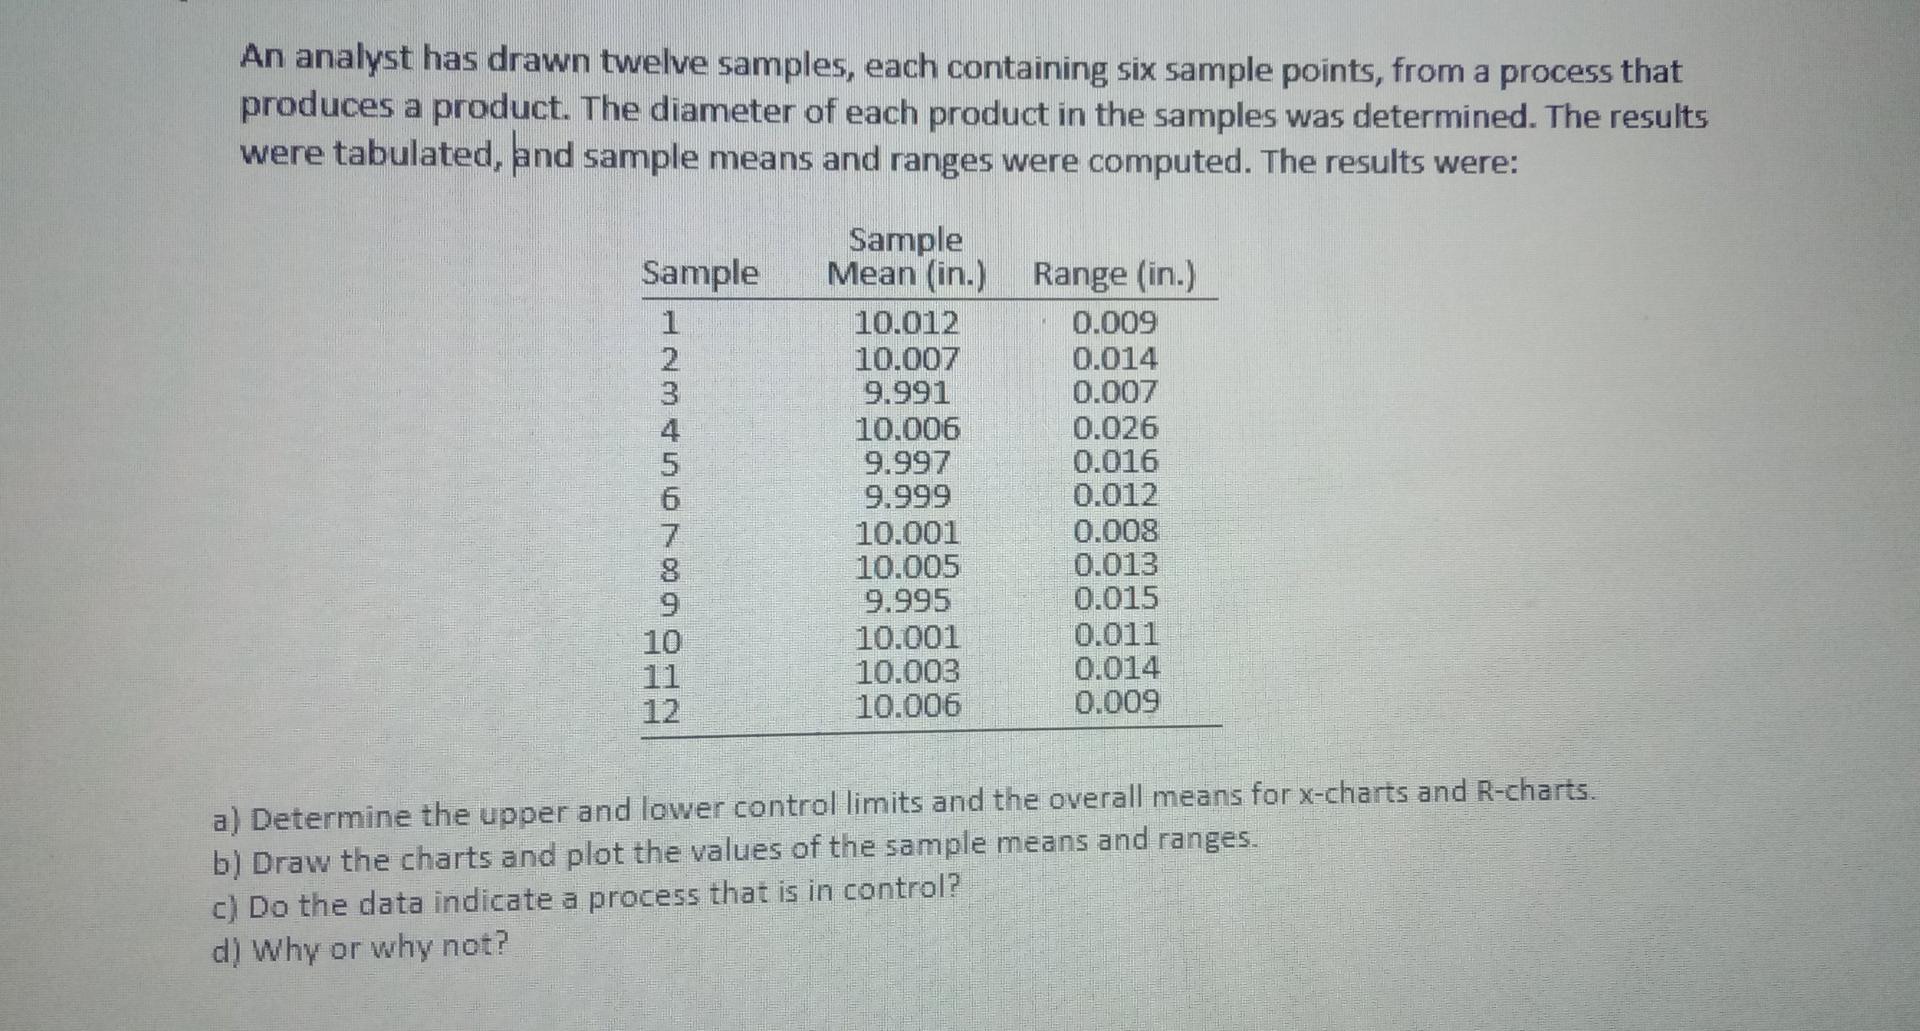
An analyst has drawn twelve samples, each containing six sample points, from a process that produces a product. The diameter of each product in the samples was determined. The results were tabulated, and sample means and ranges were computed. The results were: Sample 1 NEO000vOU AWN Sample Mean (in.) Range (in.) 10.012 0.009 10.007 0.014 9.991 0.007 10.006 0.026 9.997 0.016 9.999 0.012 10.001 0.008 10.005 0.013 9.995 0.015 10.001 0.011 10.003 0.014 10.006 0.009 6 7 10 a) Determine the upper and lower control limits and the overall means for x-charts and R-charts. b) Draw the charts and plot the values of the sample means and ranges. c) Do the data indicate a process that is in control? d) Why or why not
Step by Step Solution
There are 3 Steps involved in it
1 Expert Approved Answer
Step: 1 Unlock

Question Has Been Solved by an Expert!
Get step-by-step solutions from verified subject matter experts
Step: 2 Unlock
Step: 3 Unlock