

Question: An analyst is interested in testing whether four populations have equal means. The following sample data have been collected from populations that are assumed to
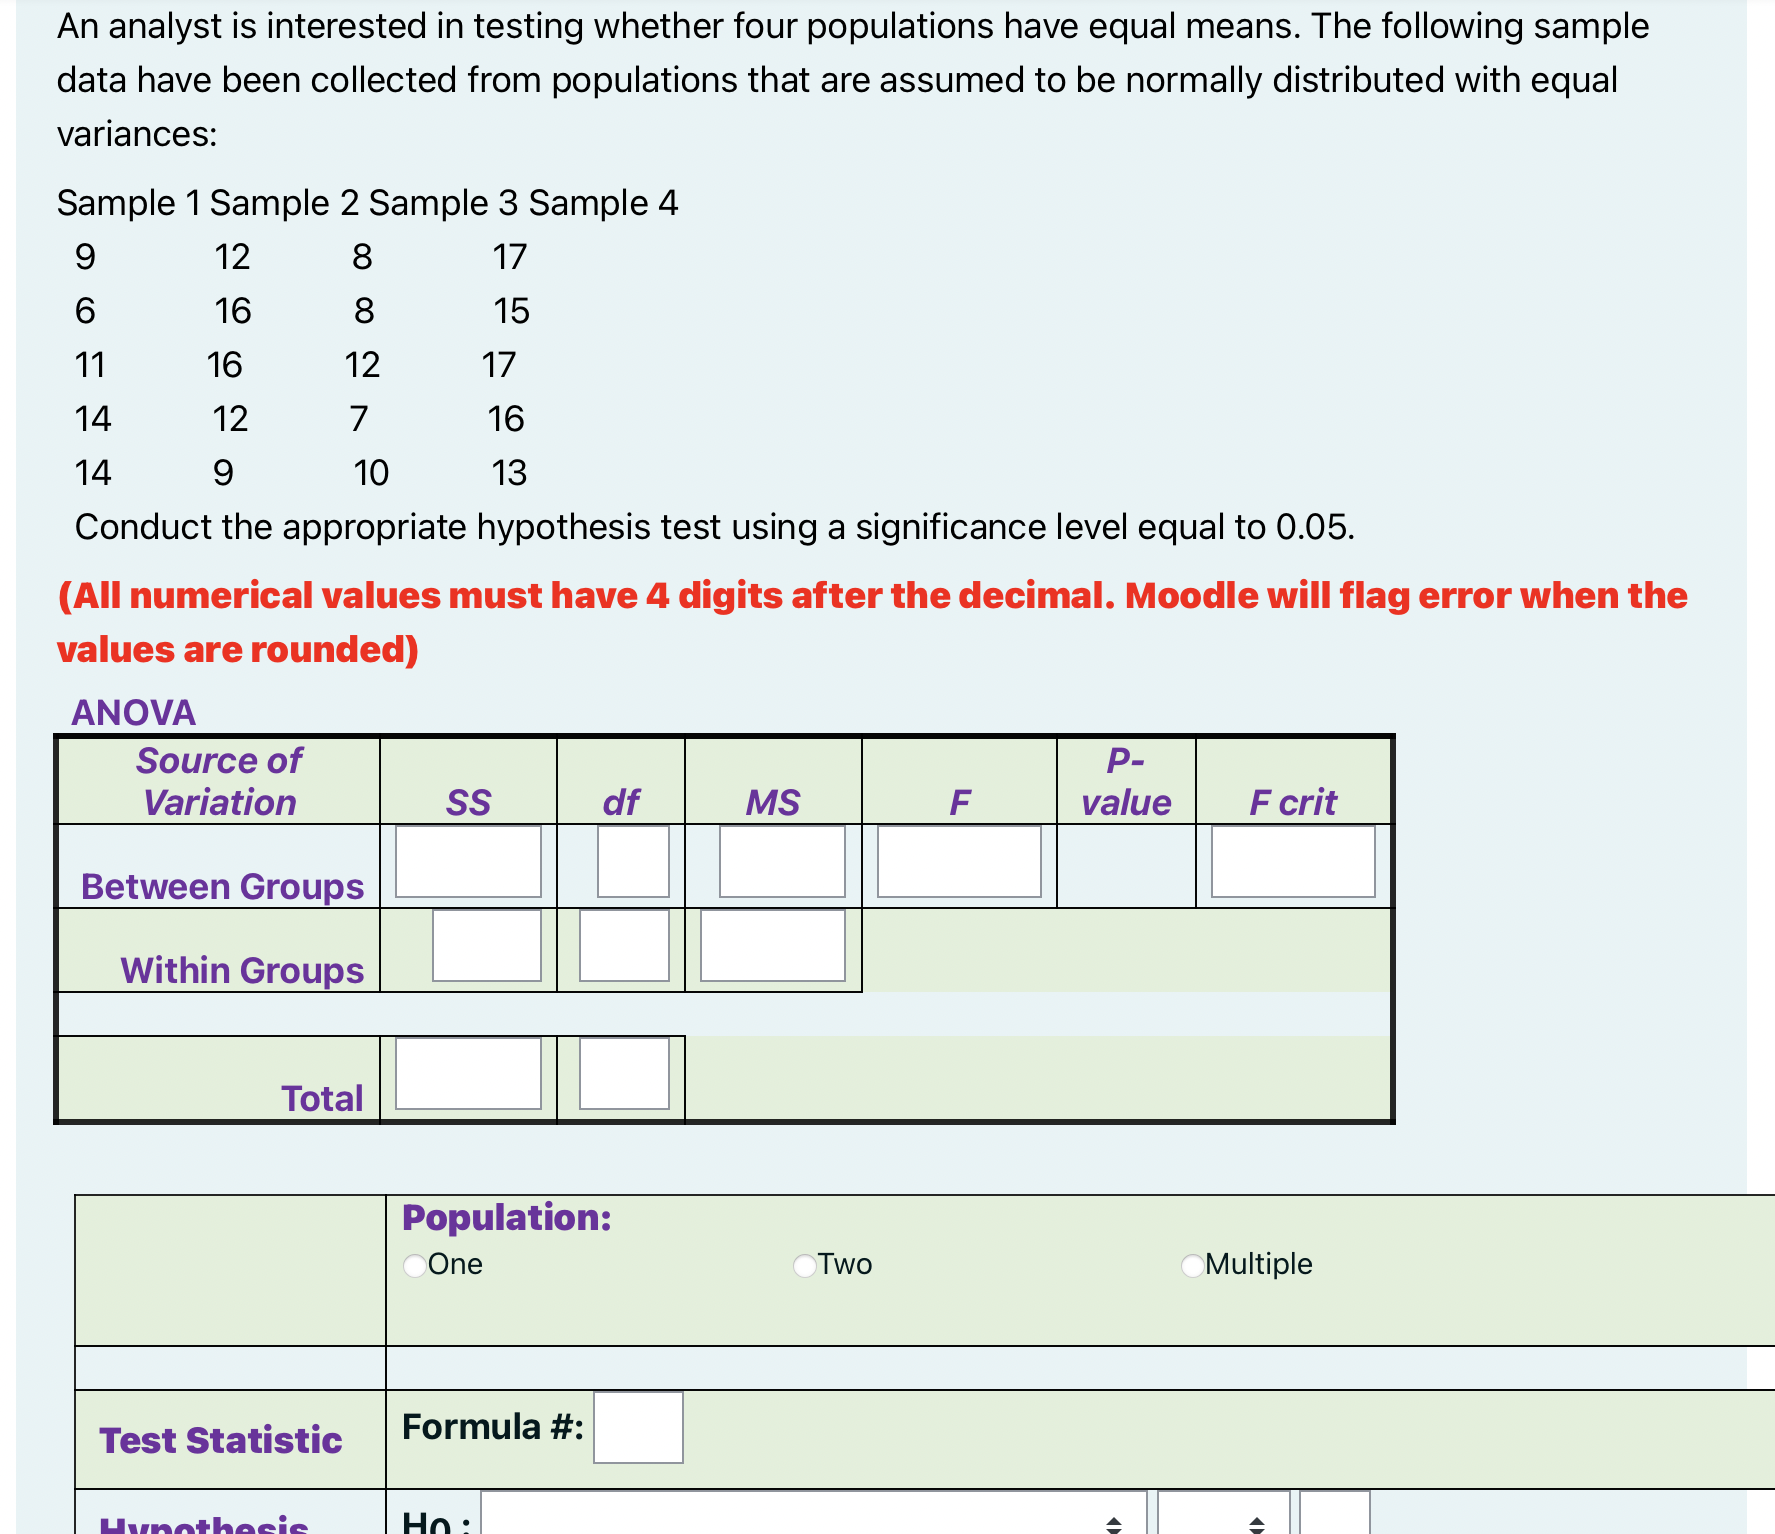
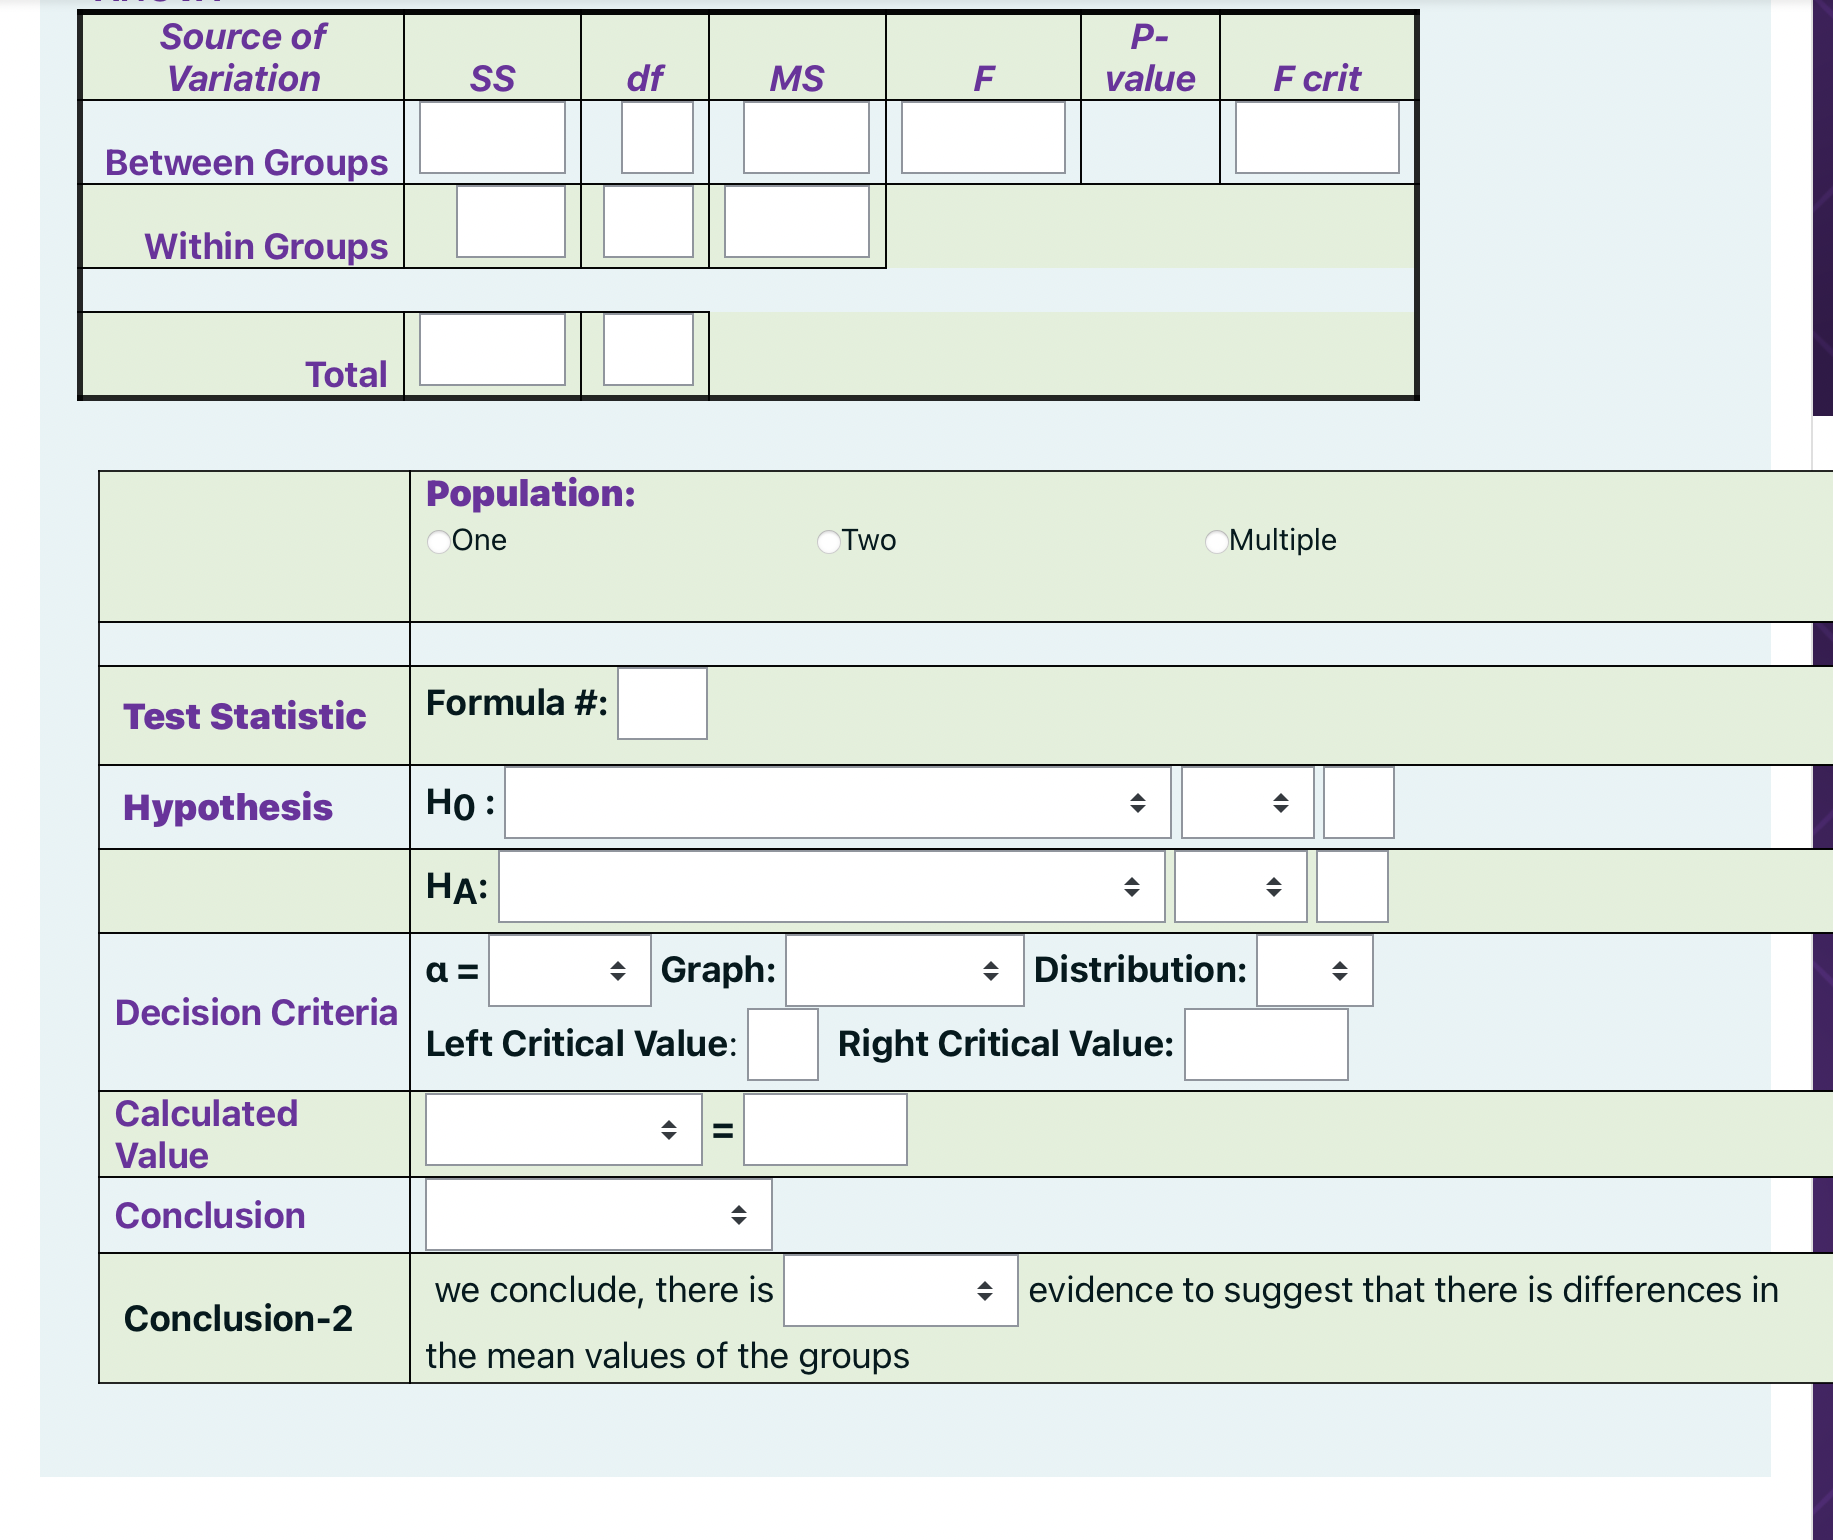


An analyst is interested in testing whether four populations have equal means. The following sample data have been collected from populations that are assumed to be normally distributed with equal variances: Sample 1 Sample 2 Sample 3 Sample 4 9 12 8 17 6 16 8 15 11 16 12 17 14 12 7 16 14 9 10 13 Conduct the appropriate hypothesis test using a significance level equal to 0.05. (All numerical values must have 4 digits after the decimal. Moodle will flag error when the values are rounded) AN OVA Source of Variation 88 M Population: ' 'One \"Two ' Multiple Test Statistic Formula #i |:| I-IllnnI-I'neie Hn E 3 3 Source of Variation Between Groups Within Groups Population: ' 'One "Two ' Multiple Test Statistic Formula #: - Hypothesis IIII HA= _ - I a = - Graph: _ Distribution: - Decision Criteria . . . . . Left Critical Value: D Right CrItIcal Value: |:| Value conc'usion l! we conclude, there is _ evidence to suggest that there is differences in Conclusion-2 the mean values of the groups
Step by Step Solution
There are 3 Steps involved in it

Get step-by-step solutions from verified subject matter experts